Using Chrome Profiler to Fix Performance Issues
In this post, you'll use the performance panel of Chrome DevTools to diagnose several performance issues that frequently slow down websites. By doing this, you'll learn the characteristics of each problem so that you can recognize them in the future. Let's get started!
How to Profile a Website with Chrome Developer Tools
You can follow these steps to use the performance panel in Chrome:
- Open a new window of Chrome in incognito mode. Using incognito mode helps reduce unnecessary noise in your performance profiles caused by factors such as your browser's installed extensions which can be undesirable. Incognito mode disables extensions by default so that they won't influence the results of your profile
- Go to the website you are interested in profiling
- Open DevTools with Command+Option+I (Mac) or Control+Shift+I (Windows)
- Click the "Performance" tabs in DevTools
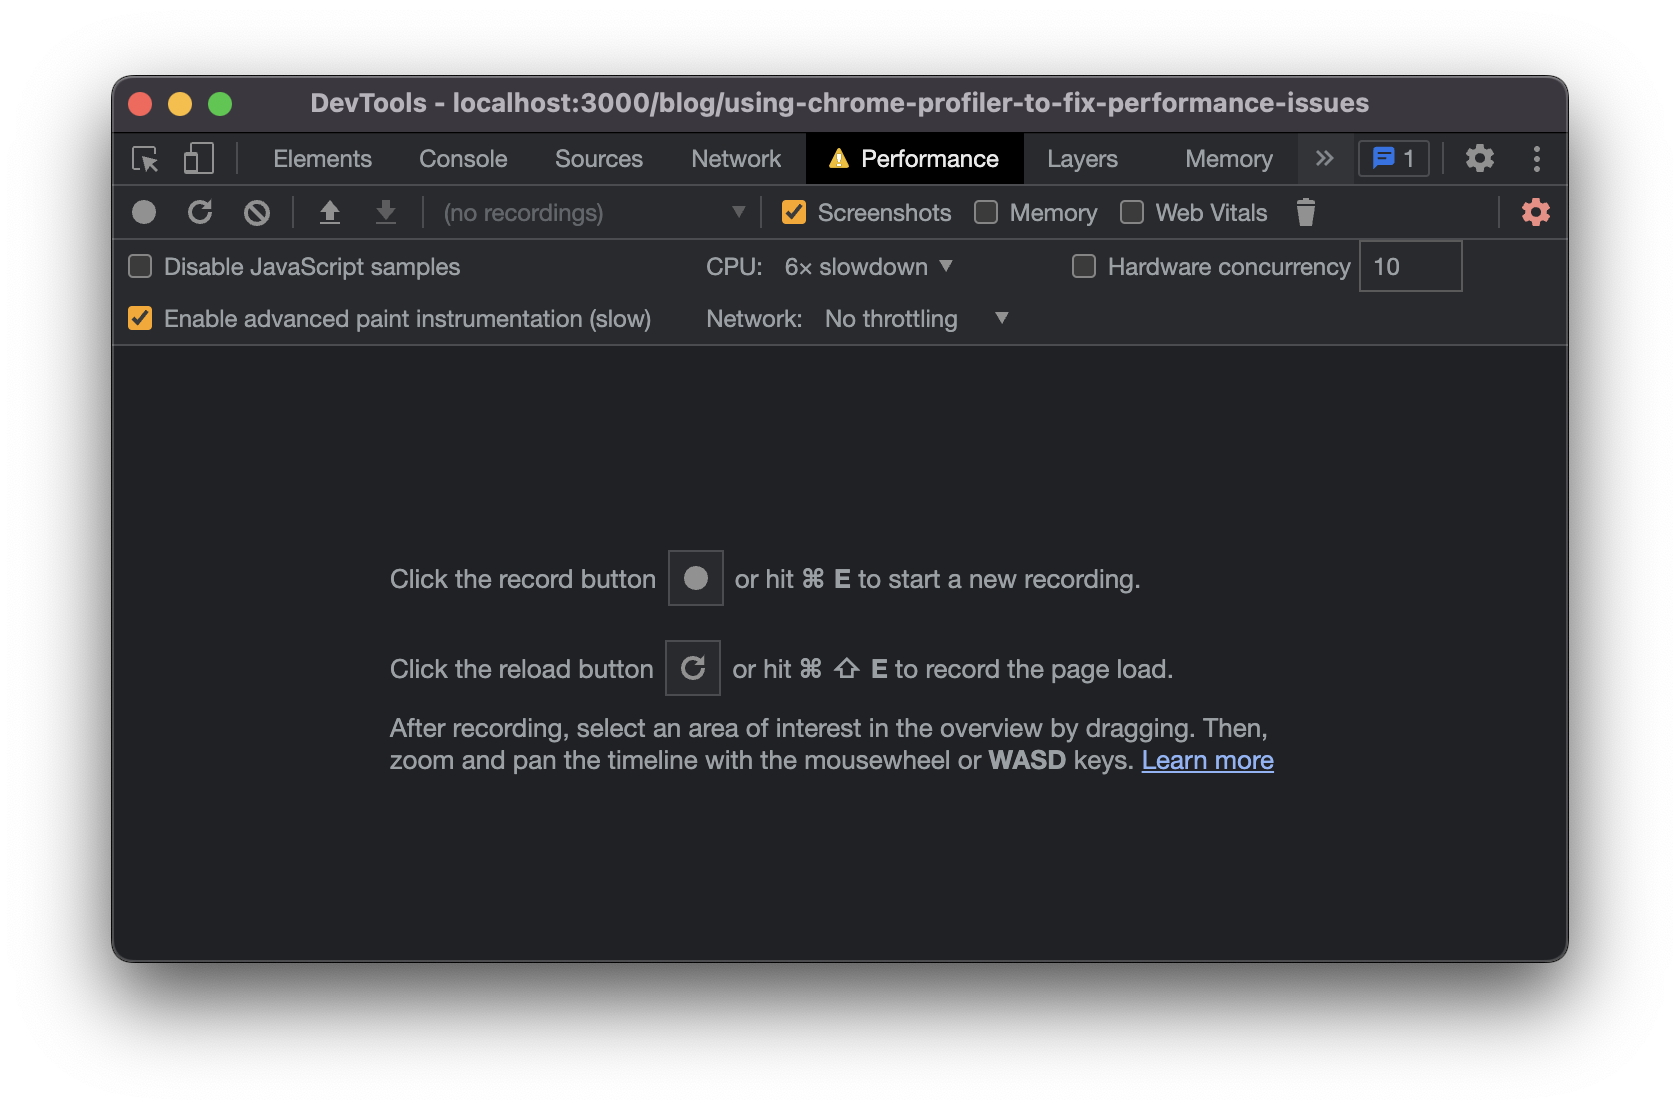
- Check the "Screenshots" and "Enable advanced paint instrumentation (slow)" checkboxes to get additional helpful data from the profile. Additionally, in the likely event that the website you are profiling serves users on mobile devices or low-end devices, change "CPU" to "4x slowdown" or "6x slowdown" to get a more realistic picture of how the website will perform on these devices
- Click the "Record" button to start profiling the runtime performance of the website
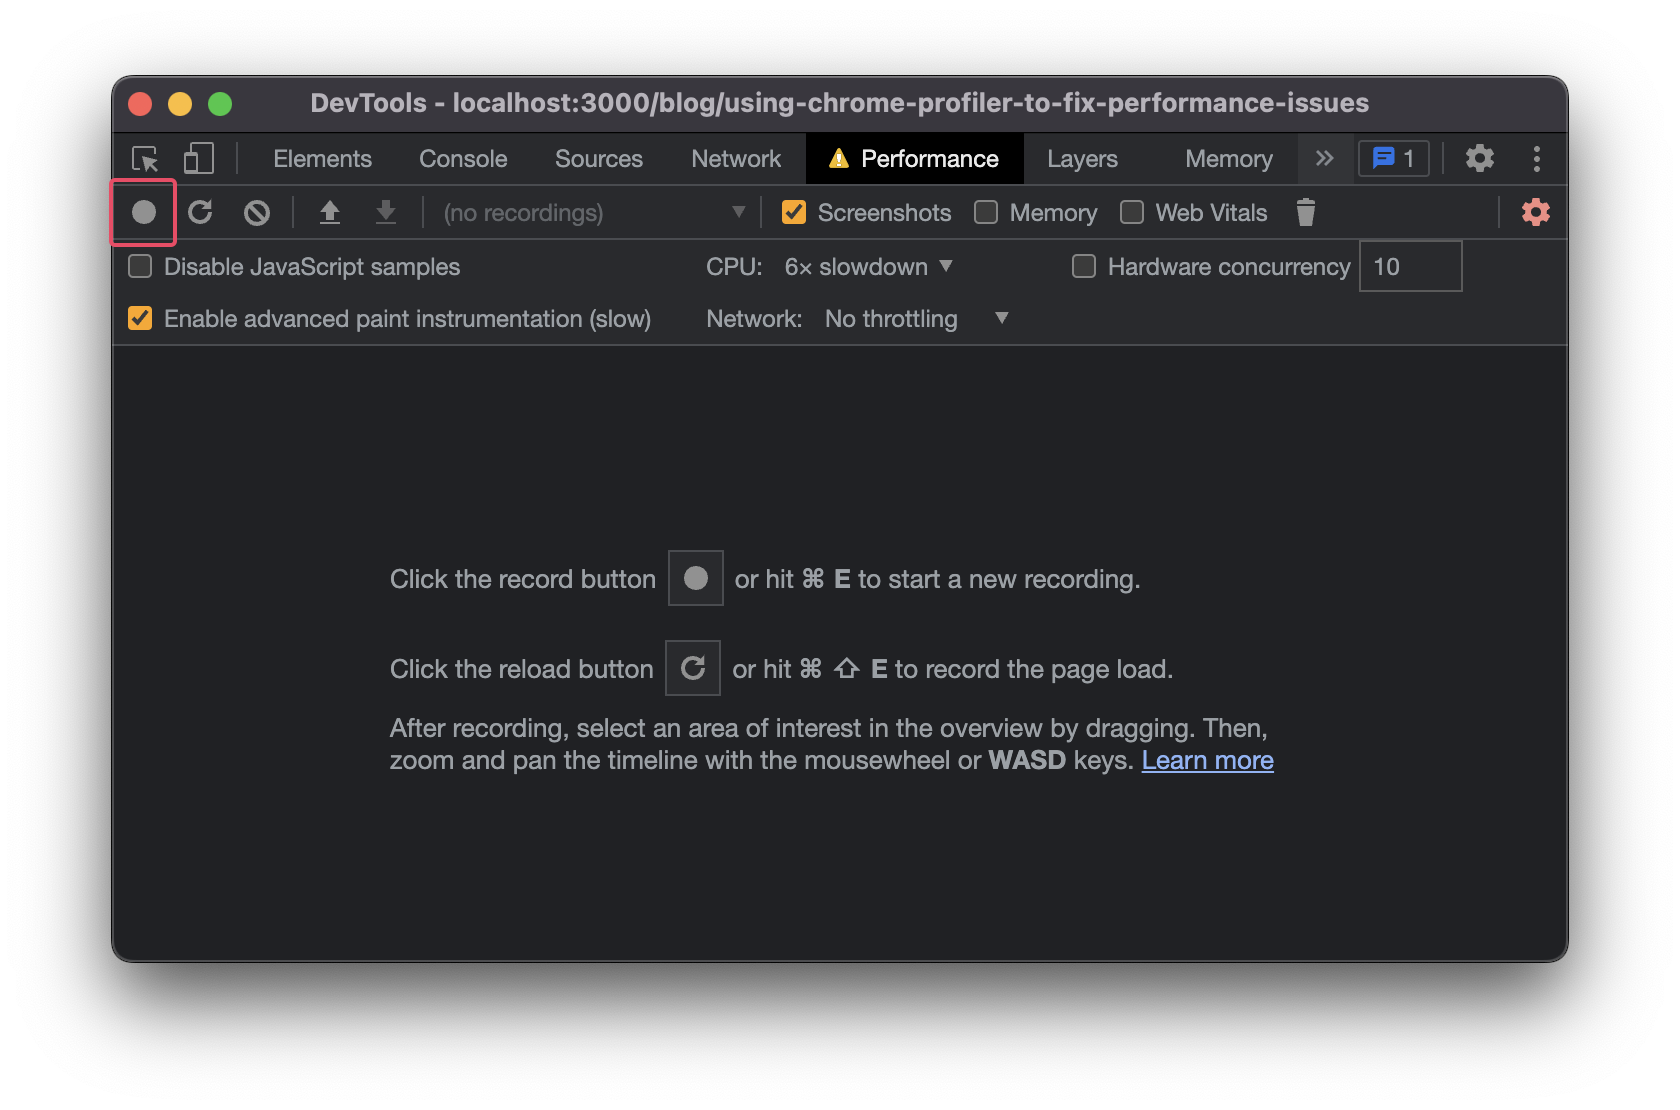
- As it's recording, perform any action that you want to measure, such as scrolling or clicking a button
- After you have performed the action(s), click the "Stop" button
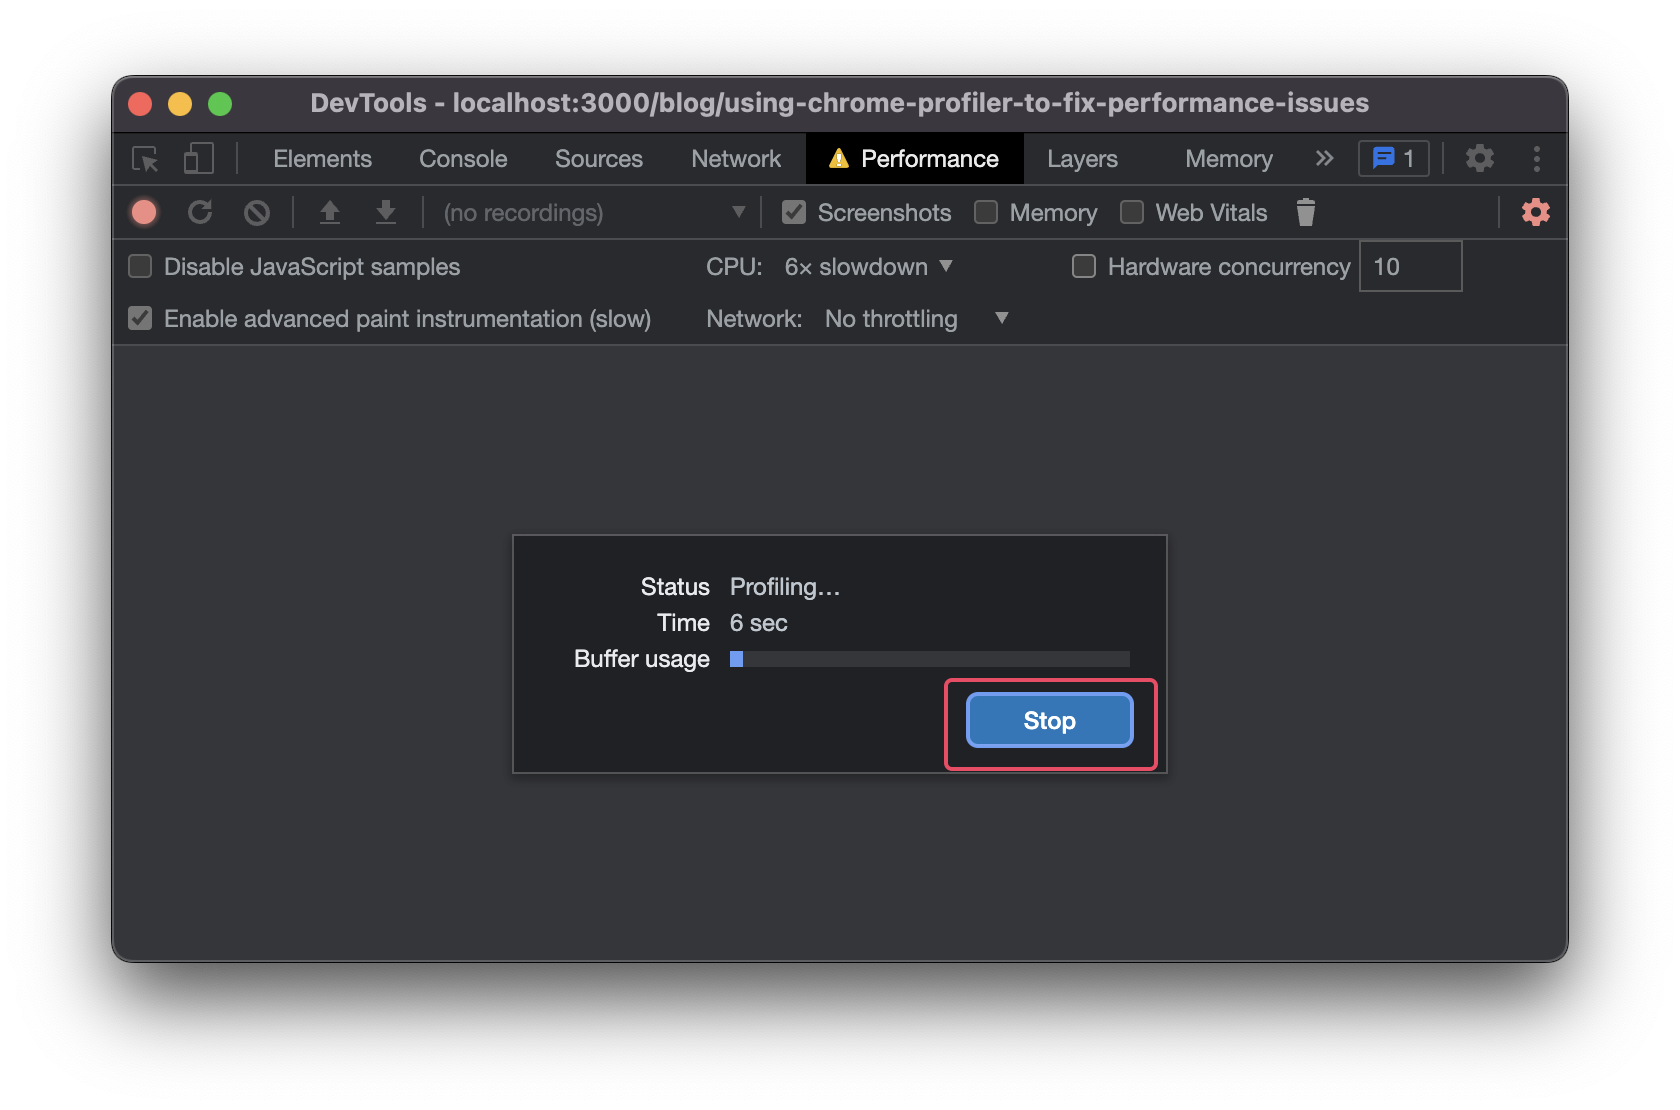
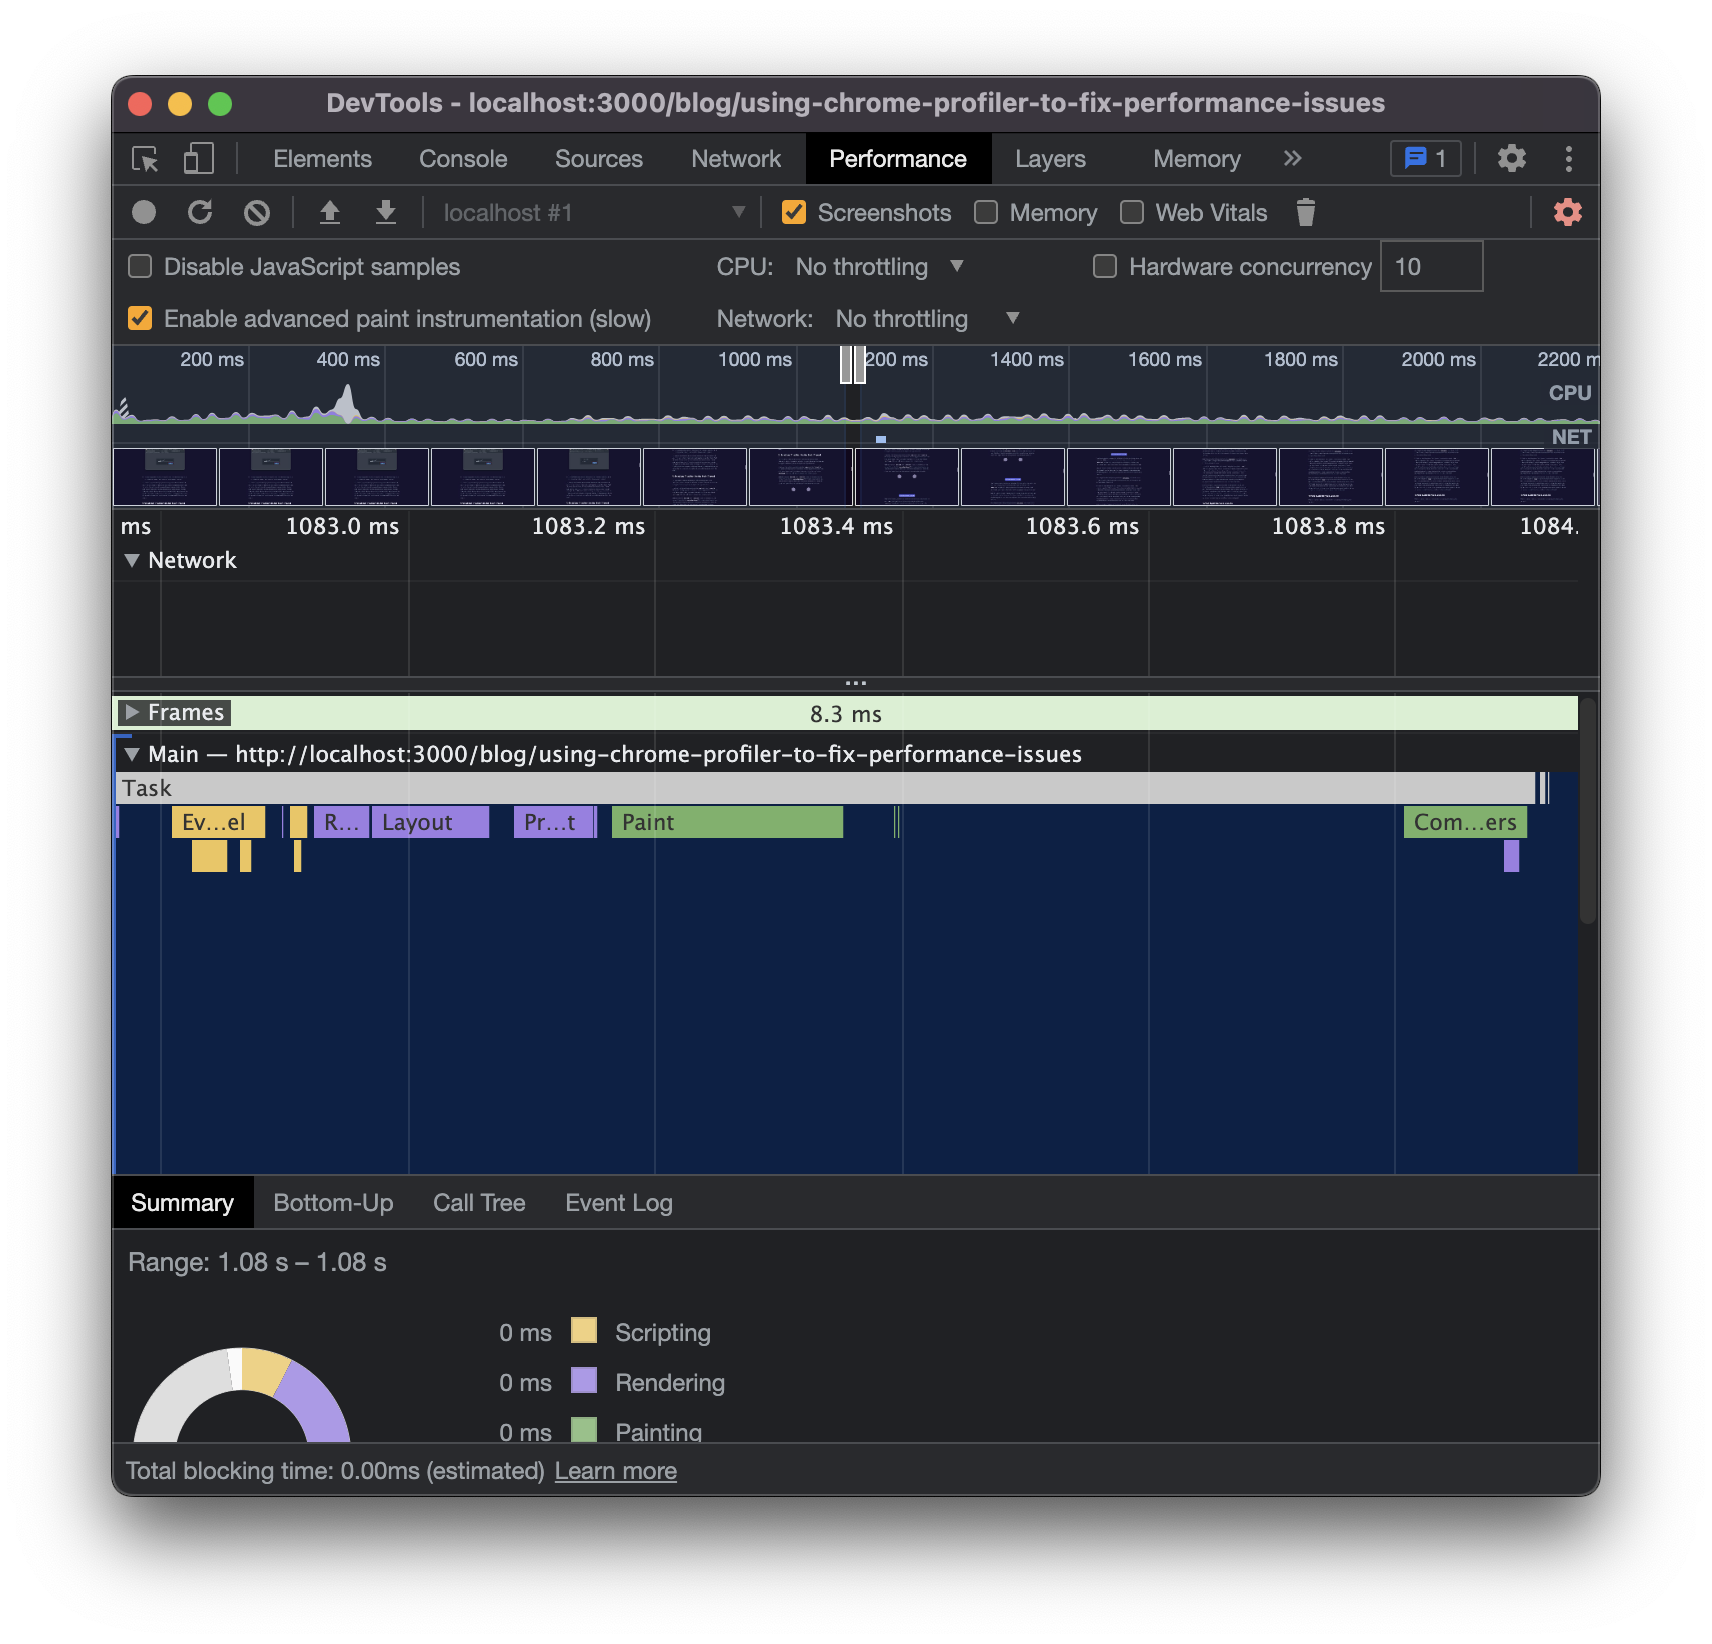
- Chrome displays the results of your profile. The results may be a bit intimidating at first, but we'll cover the basics in the subsequent sections
The previous steps show how you can profile specific actions on a website, like clicking a button or scrolling, but what if you just wanted to measure the loading performance of a website? Well, you can do that too! Instead of clicking the "Record" button mentioned in the previous steps, you click the rounded arrow button next to it.
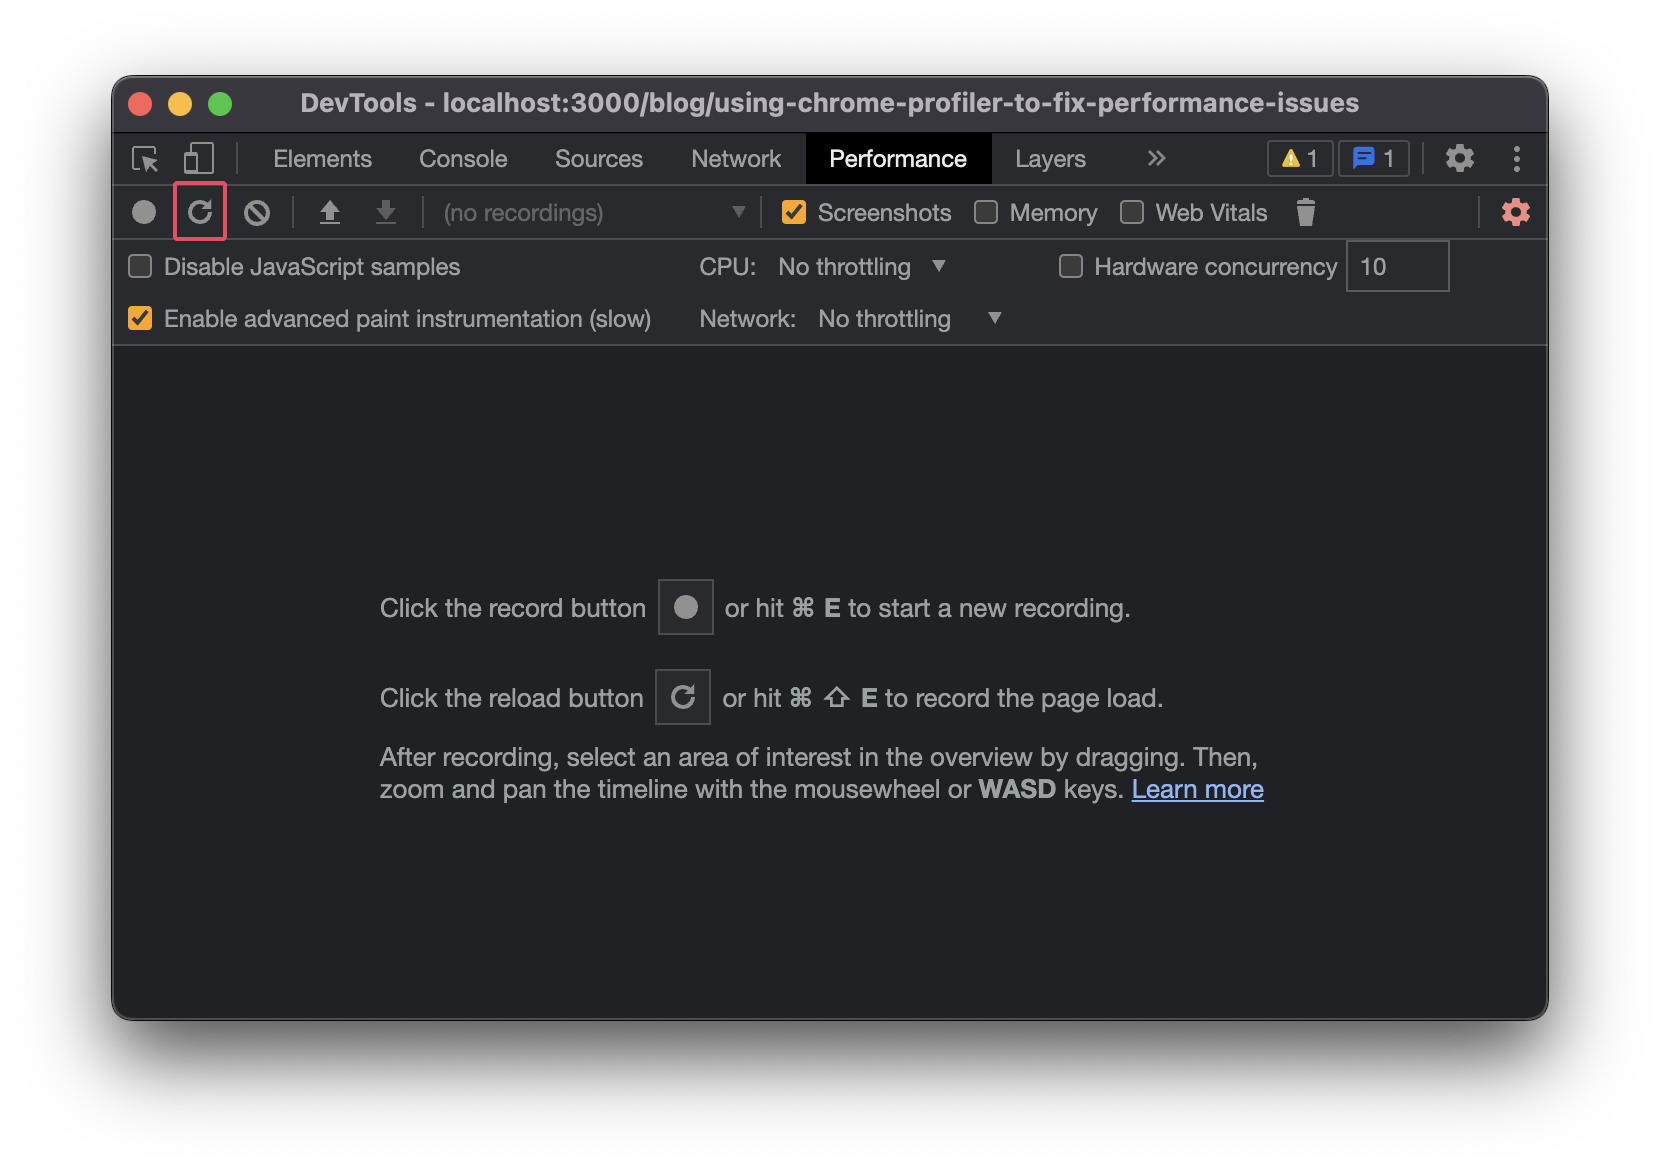
Clicking this button initiates a reload of the page and starts the profiler. After the page loads, the profiler will automatically stop and display its results.
Animations That Run On the Main Thread
When done well, adding animations to a website can enhance the user experience. However, animating certain CSS properties can actually have the opposite effect due to their poor performance.
It turns out that limiting your animations to the opacity or
transform CSS properties will give you the best chance at achieving
performant animations. Why? Animating any other CSS property will
cause it to run on the browser's
main thread
which can easily become bogged down with other work.
However, animating opacity and transform properties leverages
another browser thread called the
compositor thread. This thread
typically has a lot less competition than the main thread. Less
competition means that your animations have a much higher chance of
looking smooth and performant to the user.
In the example above, there are two animations. The only difference is
that the one on the left animates the ball's top CSS property, while
the one on the right animates the ball's transform property. As a
result, the animation on the left is running on the main thread, while
the animation to the right is leveraging the compositor thread.
Now click the button below these animations to observe what happens when the main thread is busy for 2 seconds. You should notice that the animation on the main thread grinds to a halt while the compositor thread animation keeps running smoothly.
Now let's profile what is happening. Follow the steps above, but click the "Block main thread for 2 seconds" button as part of step 7. After you've clicked the "stop" button, a profile that is similar to the one below should appear after zooming in:
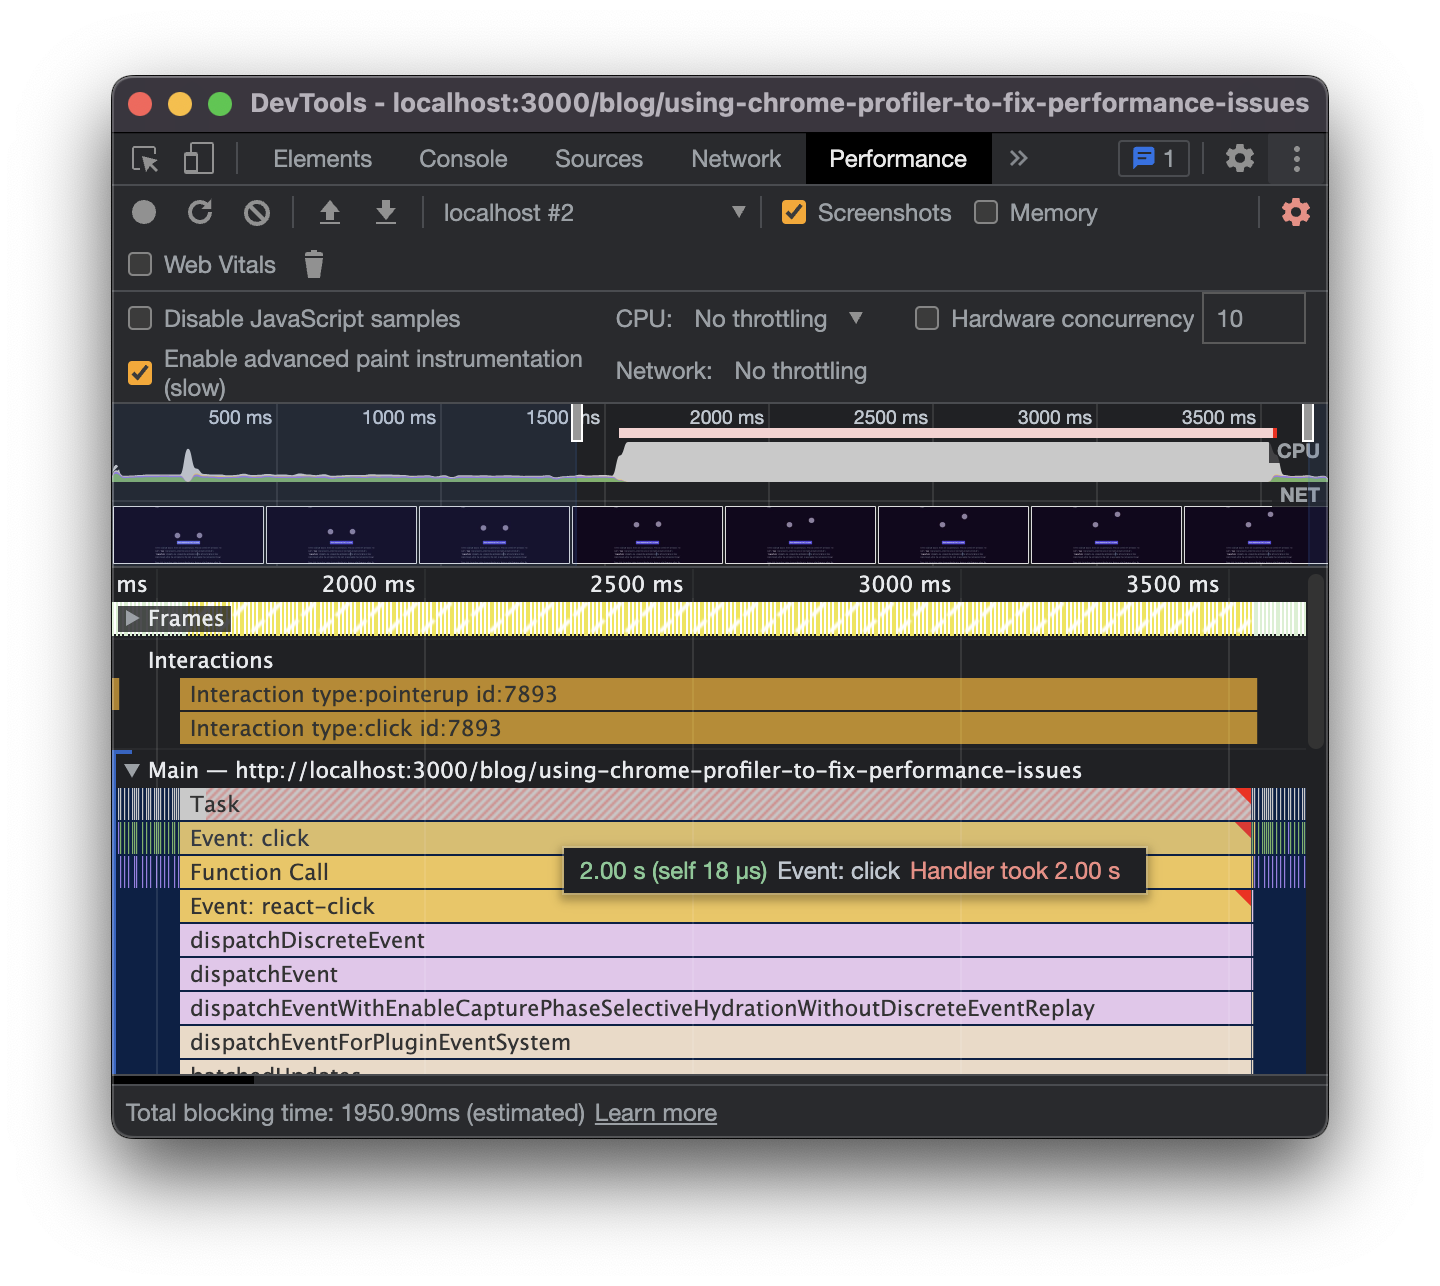
As shown in the image above, you'll notice a long yellow bar labeled
click under the expanded "Main" section. This section shows all
activity on the main thread during the recording, and the yellow bar
corresponds to your button click. Hovering over this yellow bar
displays a tooltip that indicates it took 2 seconds.
You'll also notice the 'click' bar is stacked on top of other bars. Chrome DevTools shows the main thread's activity via a flame chart. The y-axis represents the call stack, while the x-axis represents time. This stack of bars, therefore, represents the call stack that occurred when you clicked the button.
A common culprit of sluggish animation performance is too much activity on the main thread. According to the RAIL model, and assuming your display has a 60 Hz refresh rate, animations that produce a frame every 16ms will look smooth to the user. However, if the animation occurs on the main thread, long-running JavaScript tasks, such as the click handler in the demo, can block the animation from producing any new frames until the JS has finished. As a result, the animation drops frames and looks "janky". To avoid this, make sure your animations run on the compositor thread where it has a lower chance of being blocked by anything.
Forced Synchronous Layouts
The browser must produce at least one frame in order for users to see anything on their screen after visiting a website. When the browser produces a frame, the following steps can occur:
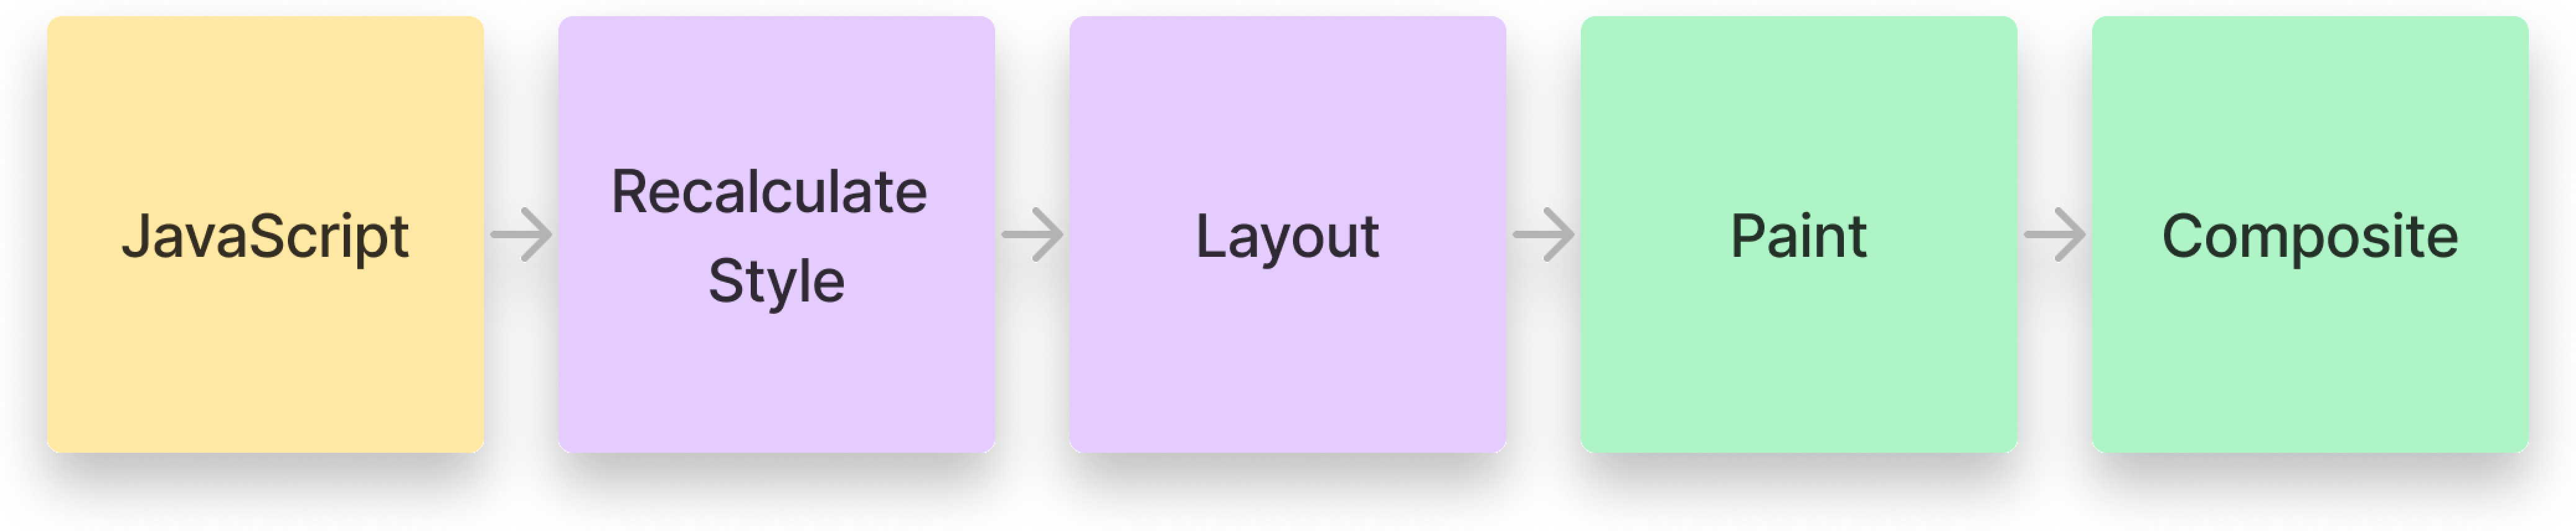
- JavaScript executes
- Style calculations. The browser determines which CSS rules apply to elements and which elements need to be updated
- Layout. The browser determines the position and size of elements
- Paint. The browser records draw calls
- Composite. The browser calculates layer info and passes it to the compositor thread
Ideally, the browser won't need to repeat any steps when producing a frame. However, what happens if JavaScript mutates the DOM (step 1) and then queries layout information about the element it mutated (step 3)?
const box = document.querySelector(".box");// Writebox.classList.add("box--large");// Readconst width = box.getBoundingClientRect().width;In the example above, we add a class to an element and then ask the
browser for its width. However, what if the newly added class affects
the element's width? The browser is forced to run steps 2 and 3 to
calculate the element's width, and it runs both of these steps before
any more JavaScript executes. This is called a
forced synchronous layout, and it can become particularly costly
when there is a write followed by a read followed by another write, as
this sequence forces the browser to perform multiple layout
calculations before producing the frame. How do we prevent this
inefficiency? The order of these calls matters a lot.
Forced Synchronous Layout Demo
Let's see an example of this. Visit the above link, and you'll notice a box at the bottom with its height and left offset position. At the top are two strategies for changing the box's height and updating its text.
The strategy on the left, "Unbatched reads/writes", iterates over each
box (currently only one), reads the current height of the box,
increments the height of each box by 10 pixels, and writes the value
in its innerText. After that, it performs another read by
calculating the relative left position of the box and writes that
value in its innerText as well. Importantly, there is a read,
followed by a write, followed by a read, followed by a
write.
The strategy on the right, "Batched reads/writes", similarly iterates
over each box but batches the two reads of height and offsetLeft
together before performing the writes. Furthermore, instead of
performing the writes in the same frame, it defers the execution of
the writes in a queue and waits until another frame passes before
executing them. Wrapping the writes in two nested
requestAnimationFrame calls defer the writes to the next frame.
Let's profile the strategy on the left by initiating a recording,
clicking the "Execute" button, and then clicking the stop button.
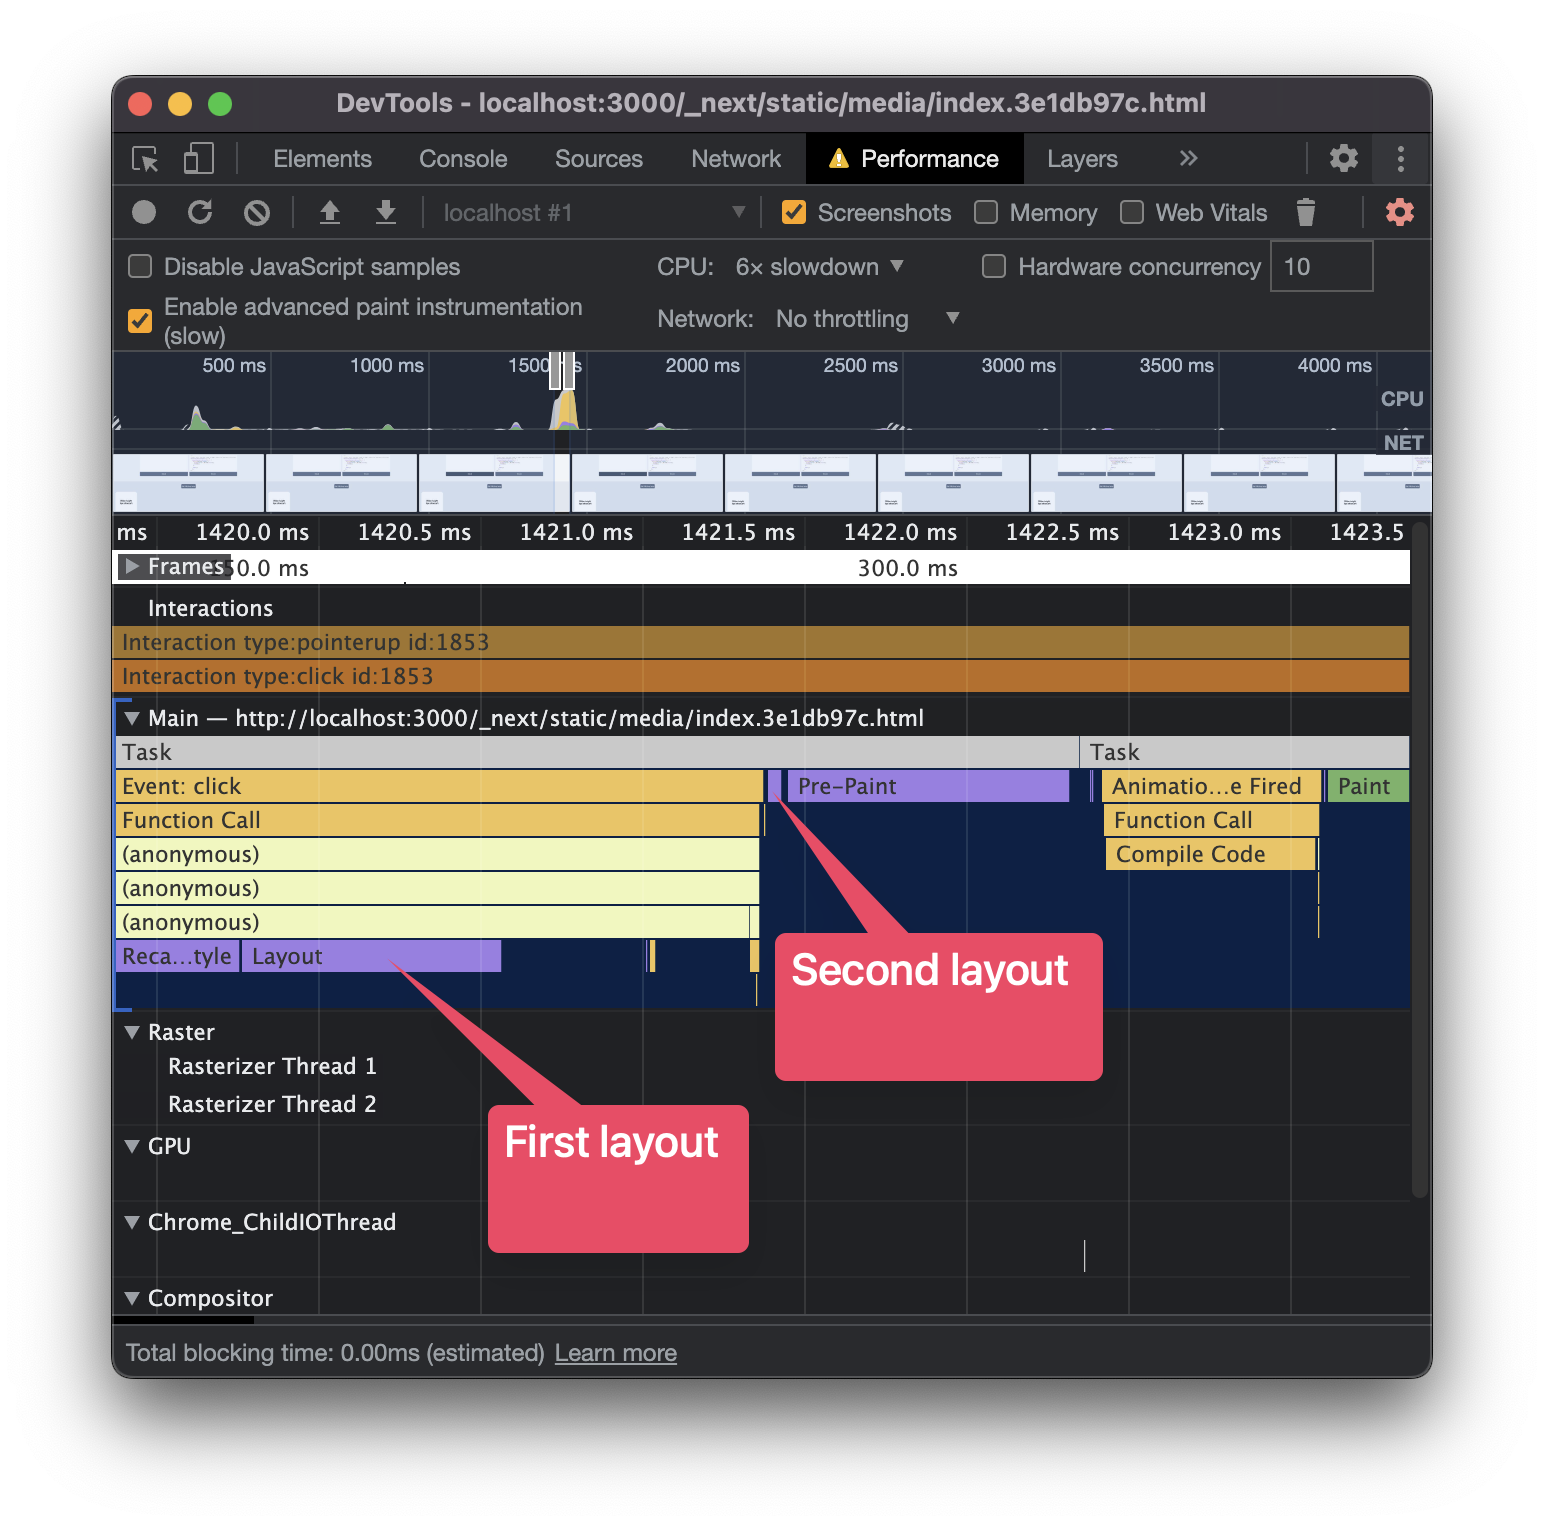
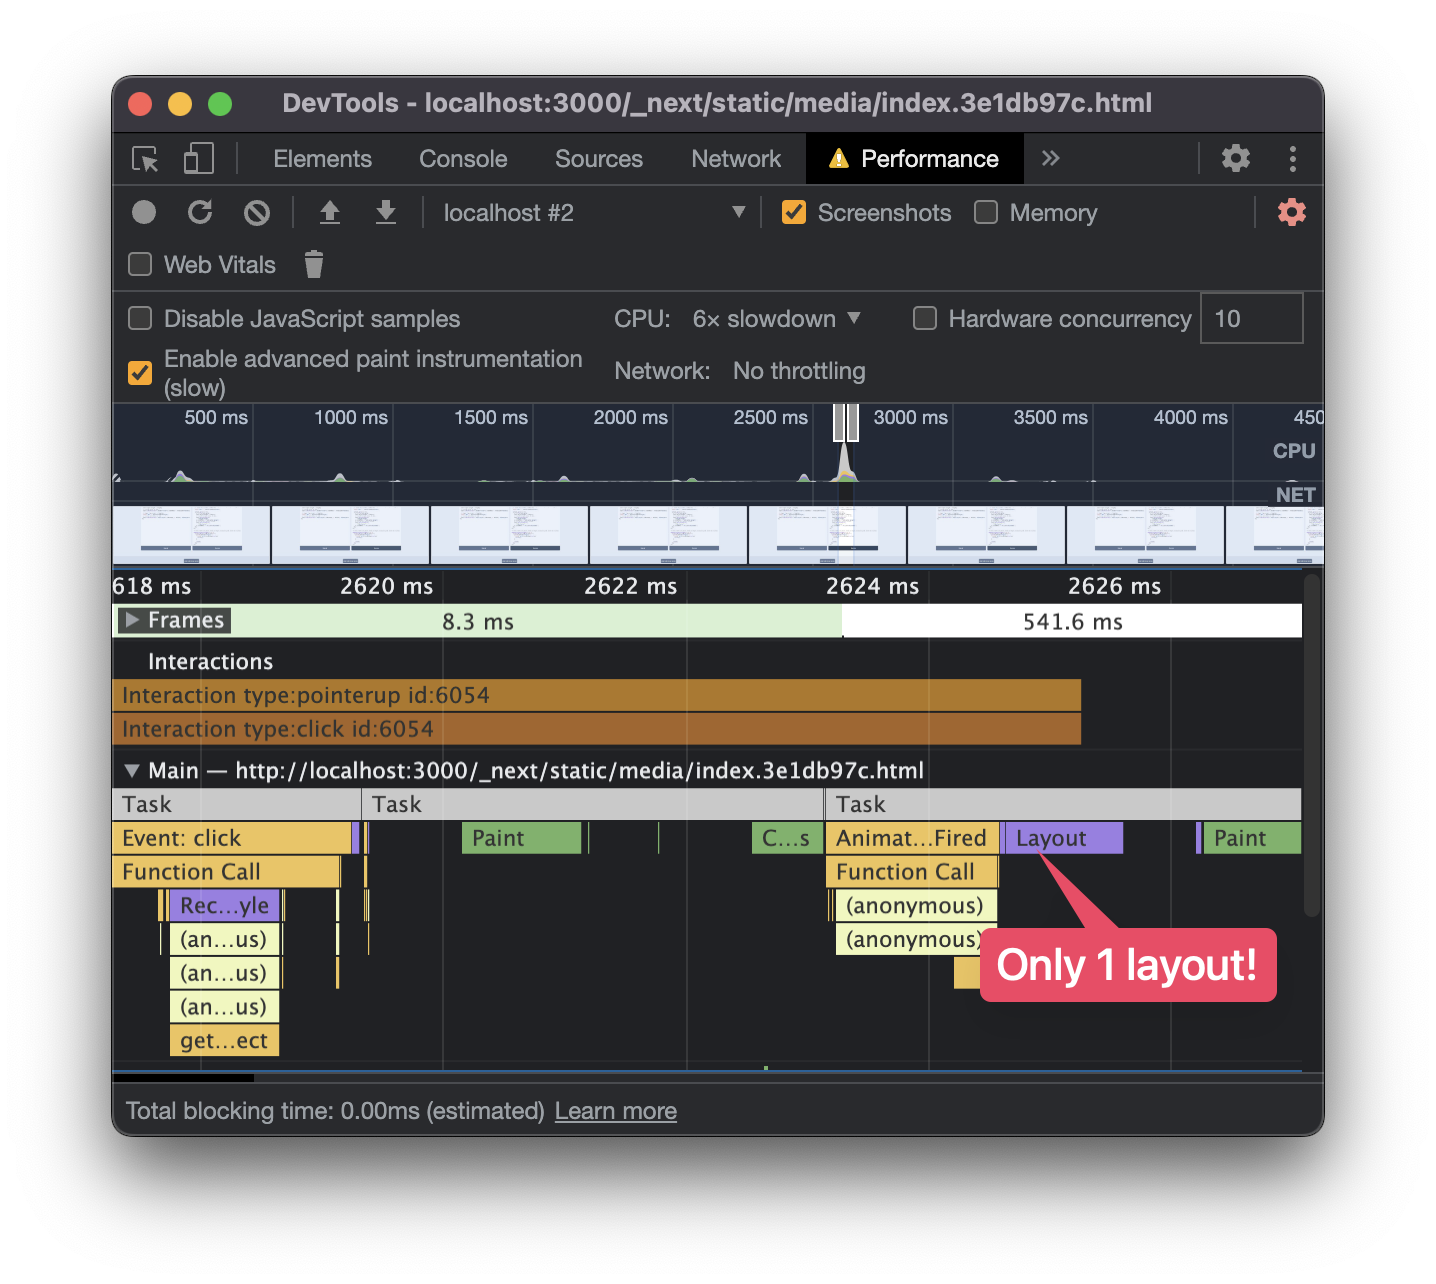
After doing this, we see something like the image above. Notice that
there are two Layout bars before the green paint bar. Because our JS
performs a write and then queries the element's layout/position, we
trigger a forced synchronous layout responsible for the first layout
bar. The final write causes the second layout bar because it
invalidates the previous layout calculation. As a result, the browser
must recalculate the layout before producing a frame.
Profiling the strategy on the right-hand side reveals a subtle difference. Instead of seeing two layout bars before the relevant paint occurs, only one is present. In this example, the forced synchronous layout found in the previous example is eliminated by batching the reads and writes together and executing all reads before any writes. The browser will still need to calculate the layout before it produces a frame, but it only needs to do this once since there aren't any reads that ask it to calculate the layout earlier than it wants. As a result, the browser can render the frame more efficiently.
Layout Thrashing
When the browser performs multiple forced synchronous layouts in the same frame, the harmful effects on performance become particularly noticeable. This inefficiency, known as "layout thrashing", commonly occurs when a read and a write execute inside a loop. We learned earlier that the order of reads and writes matter, but note that even a read followed by a write inside a loop is problematic since another read will occur during the next iteration of the loop, which triggers a forced synchronous layout.
const boxes = document.querySelectorAll(".box");
boxes.forEach((box) => { // Write box.classList.add("box--large"); // Read const width = box.getBoundingClientRect().width;});Let's go back to the same demo page as before and profile what layout thrashing looks like by following these steps:
- Click the "Add 1,000 cloned nodes" button to add 1,000 more boxes to the page
- Open the DevTools performance panel
- Click the "Record" button on the performance panel to start profiling
- Click the "Execute" button on the left-hand side
- Click the "Stop" button on the performance panel to stop profiling
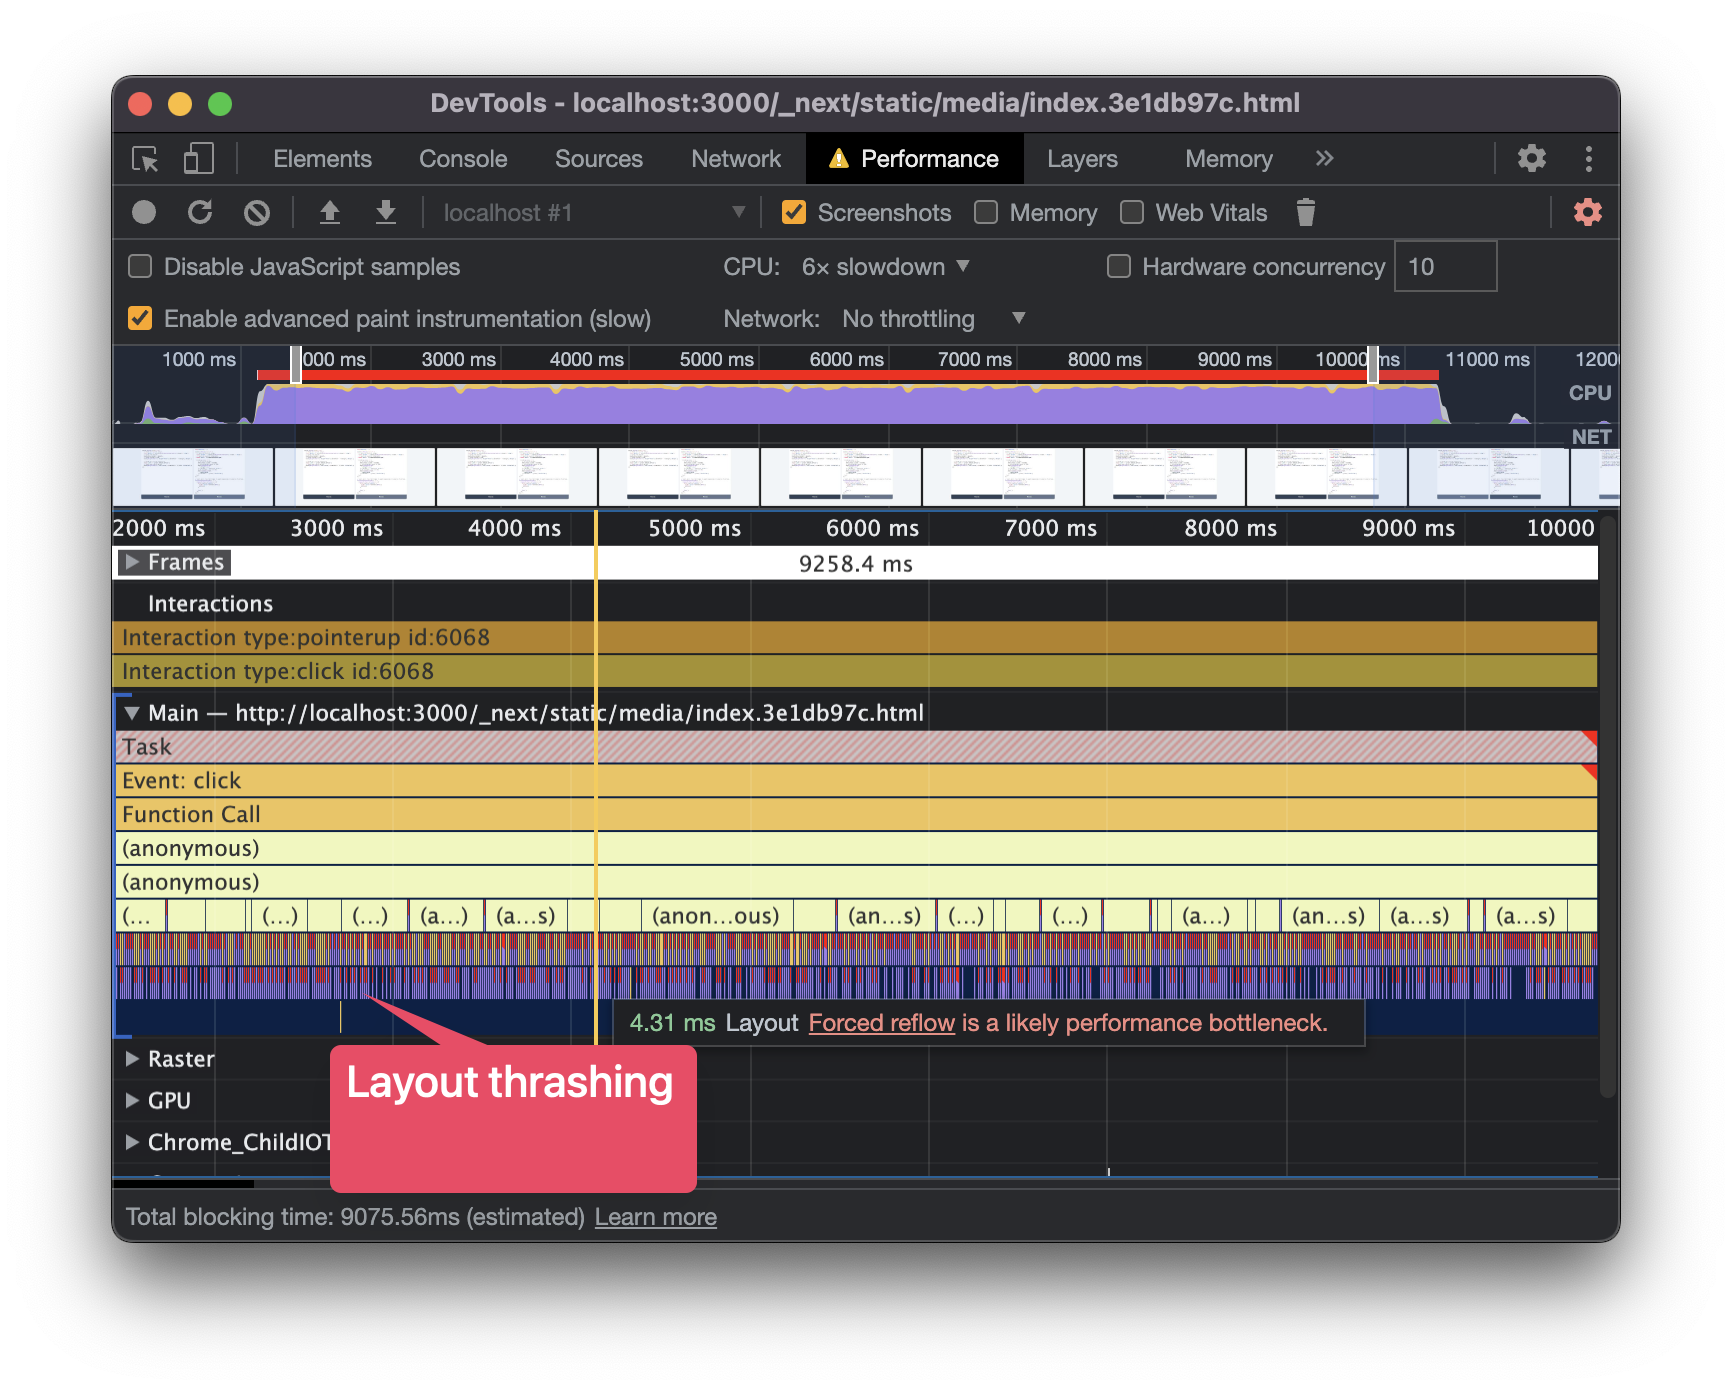
You'll notice over a thousand purple bars underneath the yellow click handler bar in the profile. These are all layout calculations! Perhaps more importantly, these calculations cause the click handler to be much slower. In my profile, with a 6x CPU throttle, it takes around 10 seconds for the click handler to complete. During this time, the main thread is blocked, and the user can't perform other actions on the page, such as clicking other buttons.
Now let's profile the strategy on the right-hand side to compare. Refresh the page and perform the same steps as above, but as part of step 4, click the "Execute" button on the right-hand side instead of the left-hand side.
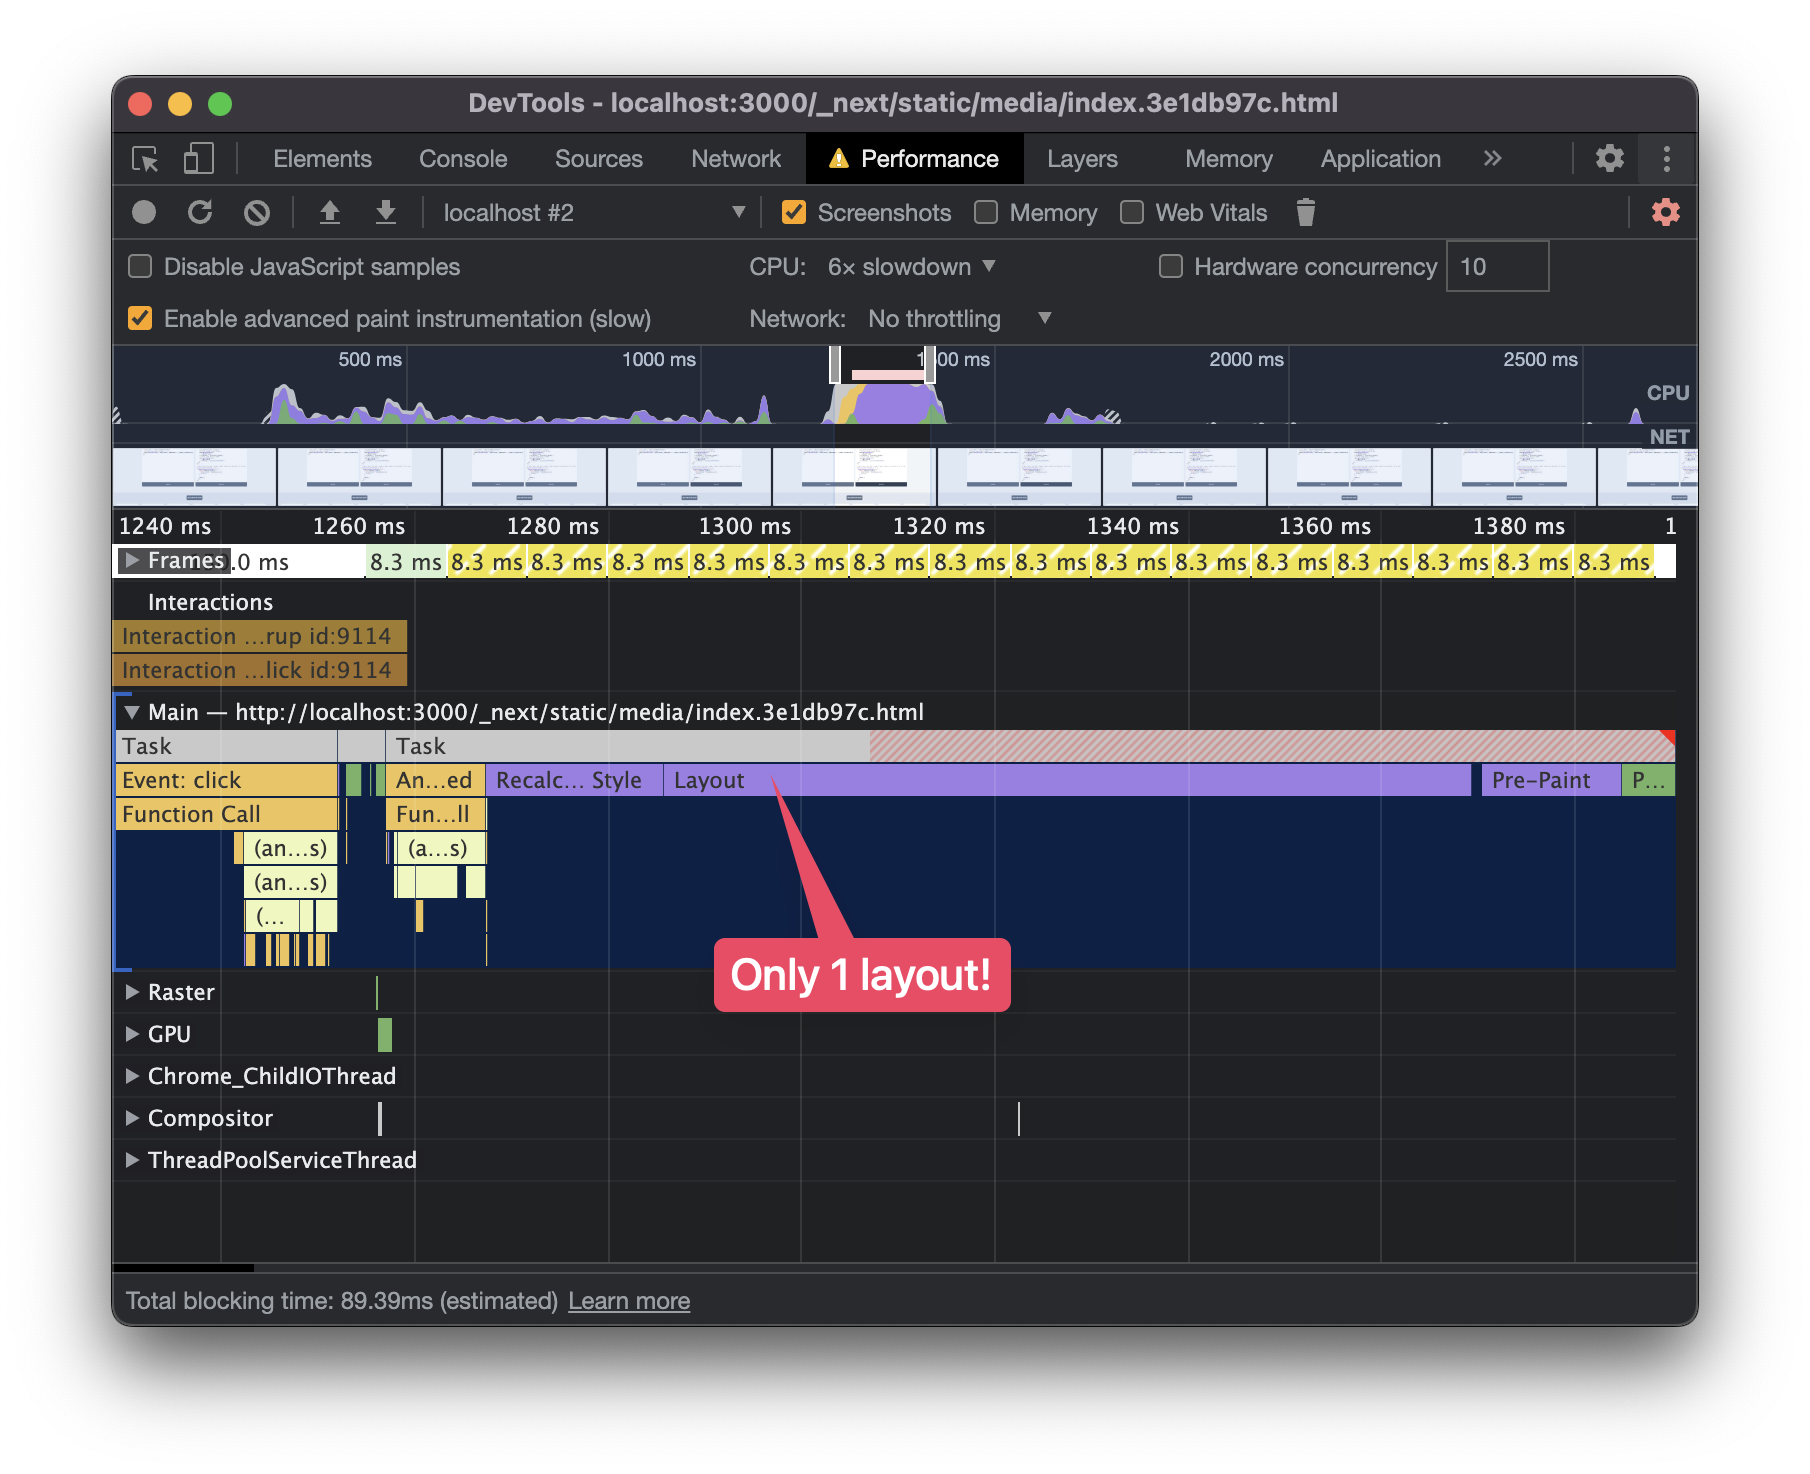
You'll notice that only one layout bar appears before the paint bar in this profile. In addition, the elapsed time between the click and the paint bar is much faster. My profile, with a 6x CPU throttle, takes around 150 ms and is around 65x faster than the previous profile. Note that the total rendering time is still longer than the 50ms budget that the RAIL model recommends for handling user input, but it is a substantial improvement from the previous example. Importantly, the user sees the updated DOM much faster and is able to perform other actions on the page because the main thread isn't blocked for a prolonged time.
As this example illustrates, the treatment for layout thrashing is to avoid writing JavaScript that causes multiple forced synchronous layouts. Preferably, all reads would occur outside the loop, and the loop would only contain writes. If the reads need to stay inside the loop, you can batch the writes together and defer their execution to another frame, like in this example. Either way, we can eliminate the layout thrashing and substantially improve the rendering performance and the user experience.
Conclusion
Now that you have learned how to recognize inefficient animations, forced synchronous layouts, and layout thrashing through performance profiles, the next step is to use this knowledge in the wild. Profile websites in production and see if you can spot any of these inefficiencies. Better yet, diagnose and fix any issues you observe and improve the website's user experience.