Analyzing Wikipedia's Search Performance
Wikipedia's desktop site is getting an updated look for the first time in over a decade, and that new experience will feature a search component. As part of a case study for adopting a modern Javascript framework in MediaWiki, the software that powers Wikipedia, we developed the new typeahead search component using the Vue.js framework. One of our goals for this project was to improve the search experience from the old legacy search component by including more contextual information such as article descriptions and thumbnails in the search suggestion results.

Since users across the world visit Wikipedia using a wide range of internet connection speeds and device specs, our team puts a premium on performance and we generally try to avoid loading anything but essential scripts and styles on the critical rendering path. To do this, the legacy search component loads most of its resources (JS, CSS, i18n messages) "lazily" and defers downloading the resources until the user first focuses the input. Once loaded, the search component shows suggestions based on what the user has typed in the input. This kind of lazy loading strategy is commonly seen on mobile sites that defer loading images until they enter the viewport. For the new search component, we chose to follow suit and also load the new search component when the user first focuses the input. However, we knew, regardless of the loading strategy used, that comparing the performance of the legacy search component with the performance of the new Vue search component would be important.

Implementing synthetic performance tests
There are two types of performance metrics that we collect at Wikipedia. One method involves collecting metrics from real users (commonly referred to as "real user monitoring"). Another method is to use synthetic performance tests which are automated scripts that run in a controlled environment and simulate user behavior. During the course of this project, one of my responsibilities was to implement synthetic performance instrumentation that would help us compare the performance of the legacy search component with the Vue search component and also facilitate detecting performance regressions in both legacy and Vue search implementations. The synthetic test would collect performance metrics related to loading the search experience and the list of suggestions that appear after typing characters into the input.

Metric definitions
Although there are multiple ways to measure the performance of the search experience, I was interested in measuring several specific aspects:
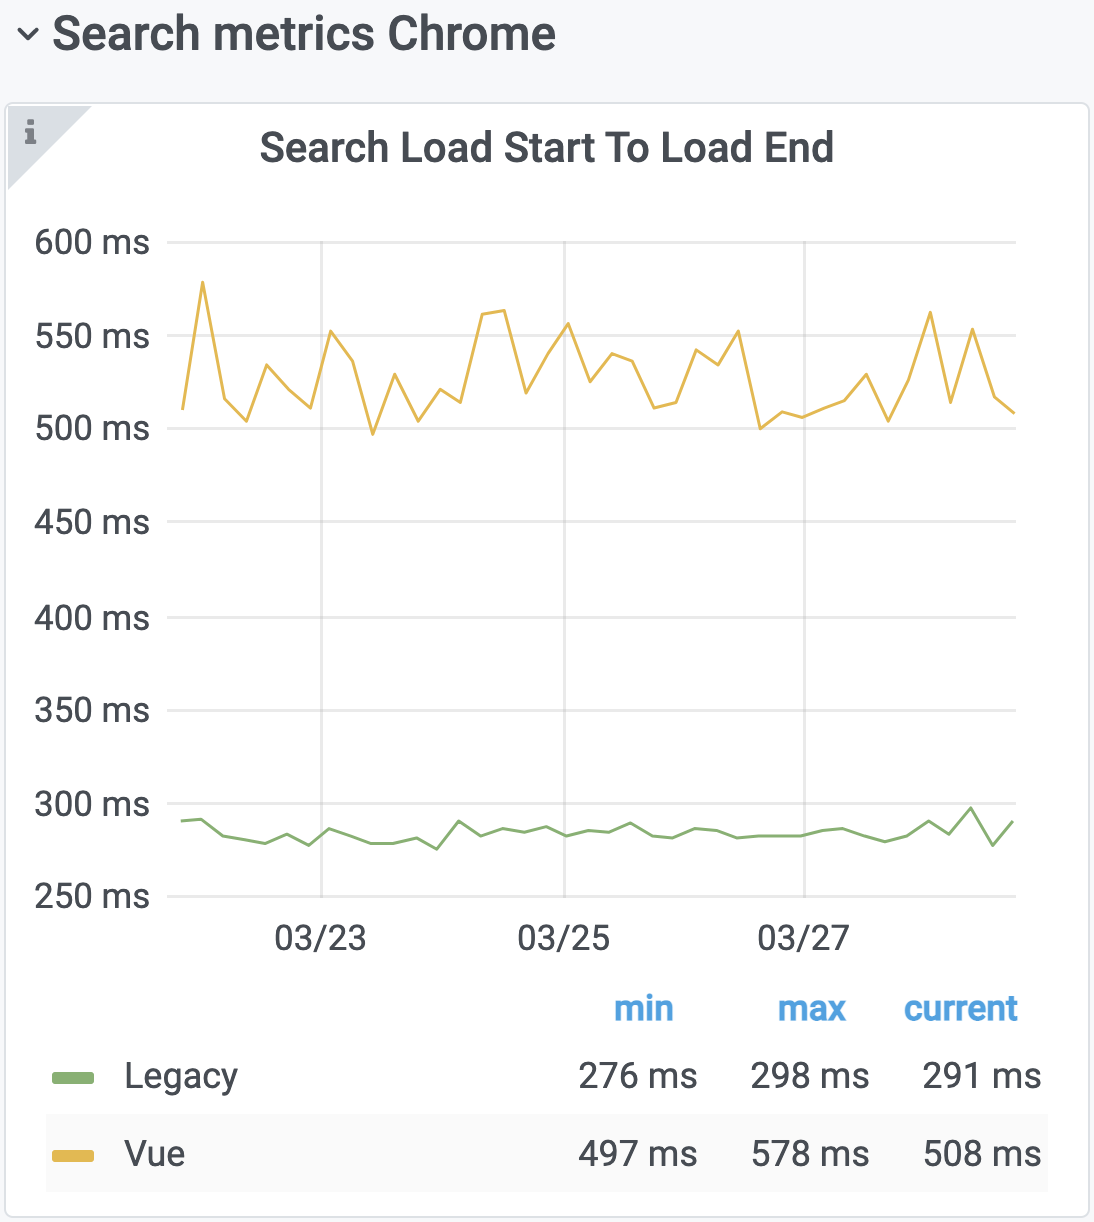
Metric 1: Search Load Start To Load End
The time it takes to lazy load and execute the search resources (e.g. JS, CSS, i18n message) when the input is focused. At Wikipedia, we package the related resources together in JS and refer to that package as a "module". Multiple modules are required for both the legacy and Vue search experiences.

Metric 2: Search Load Start To First Render
The time it takes from the start of lazy loading the search modules to the point at which the first set of search suggestions are shown to the user.

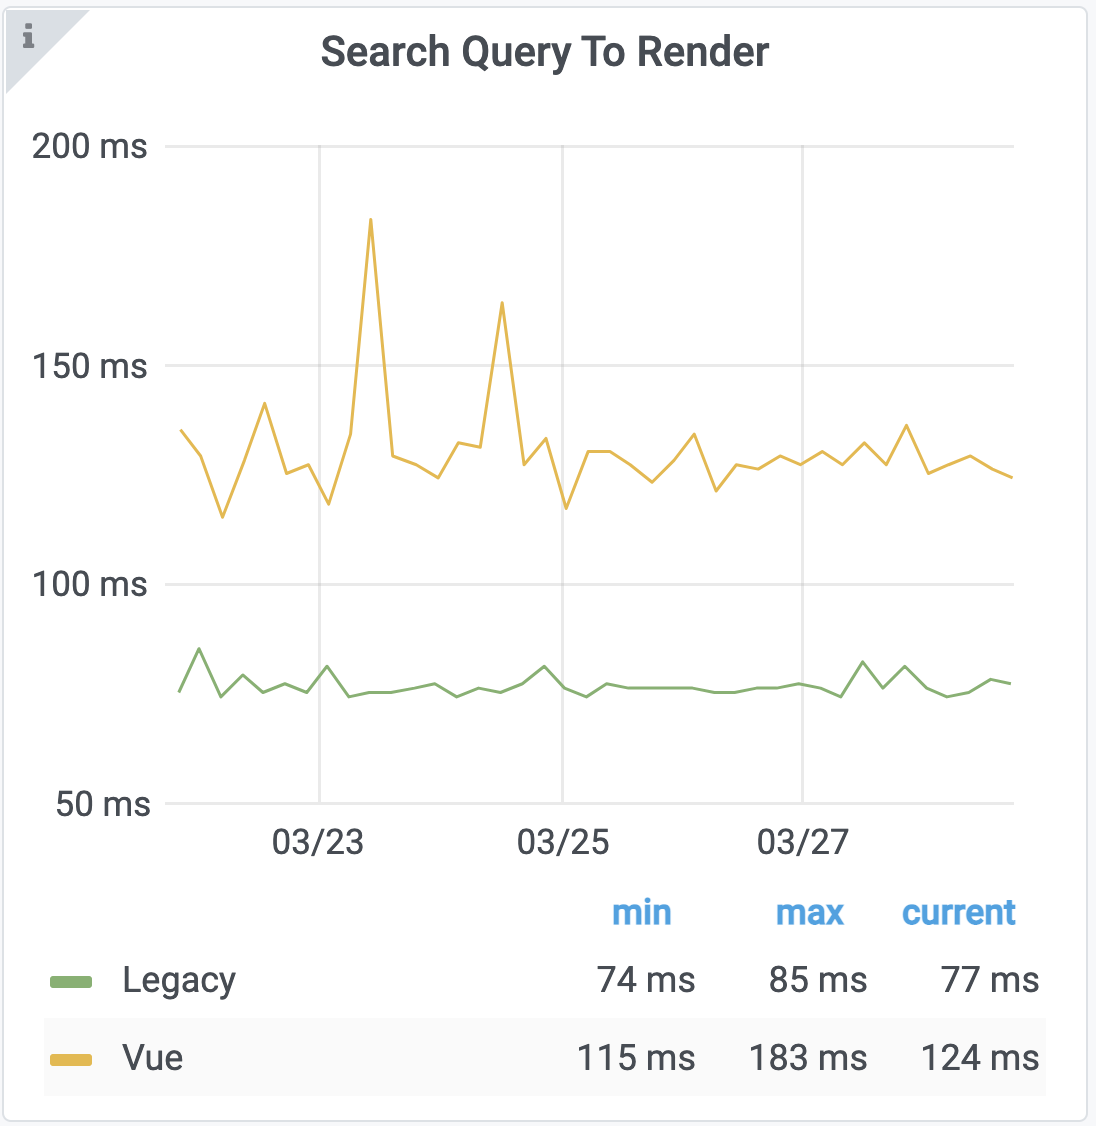
Metric 3: Search Query To Render
The time it takes to fetch and show each set of search suggestions using three different queries (“a”, “ab”, “abc”). The graphic below depicts the set of steps for the query "a".

All the steps that happen in the synthetic test
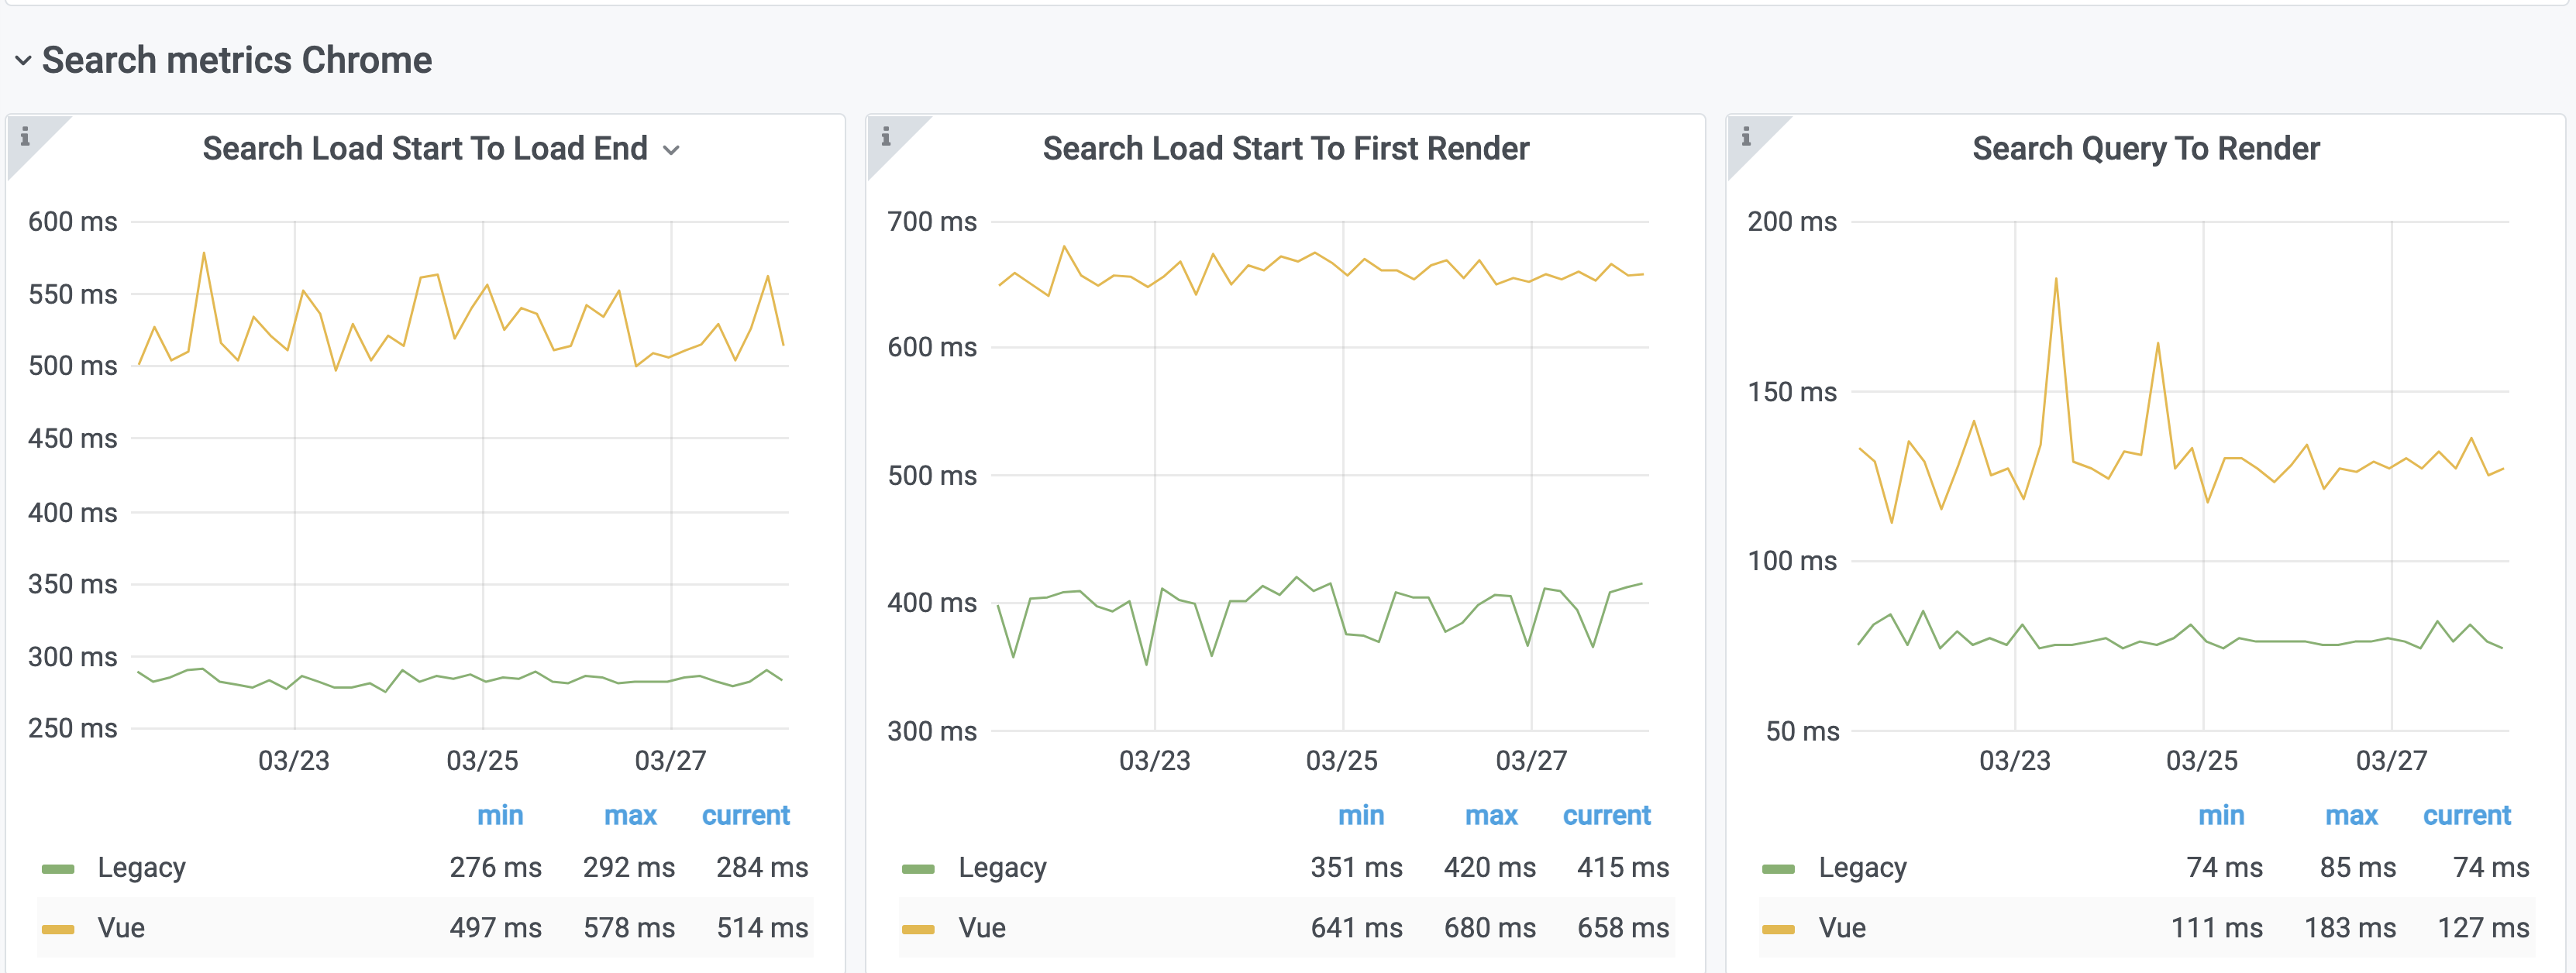
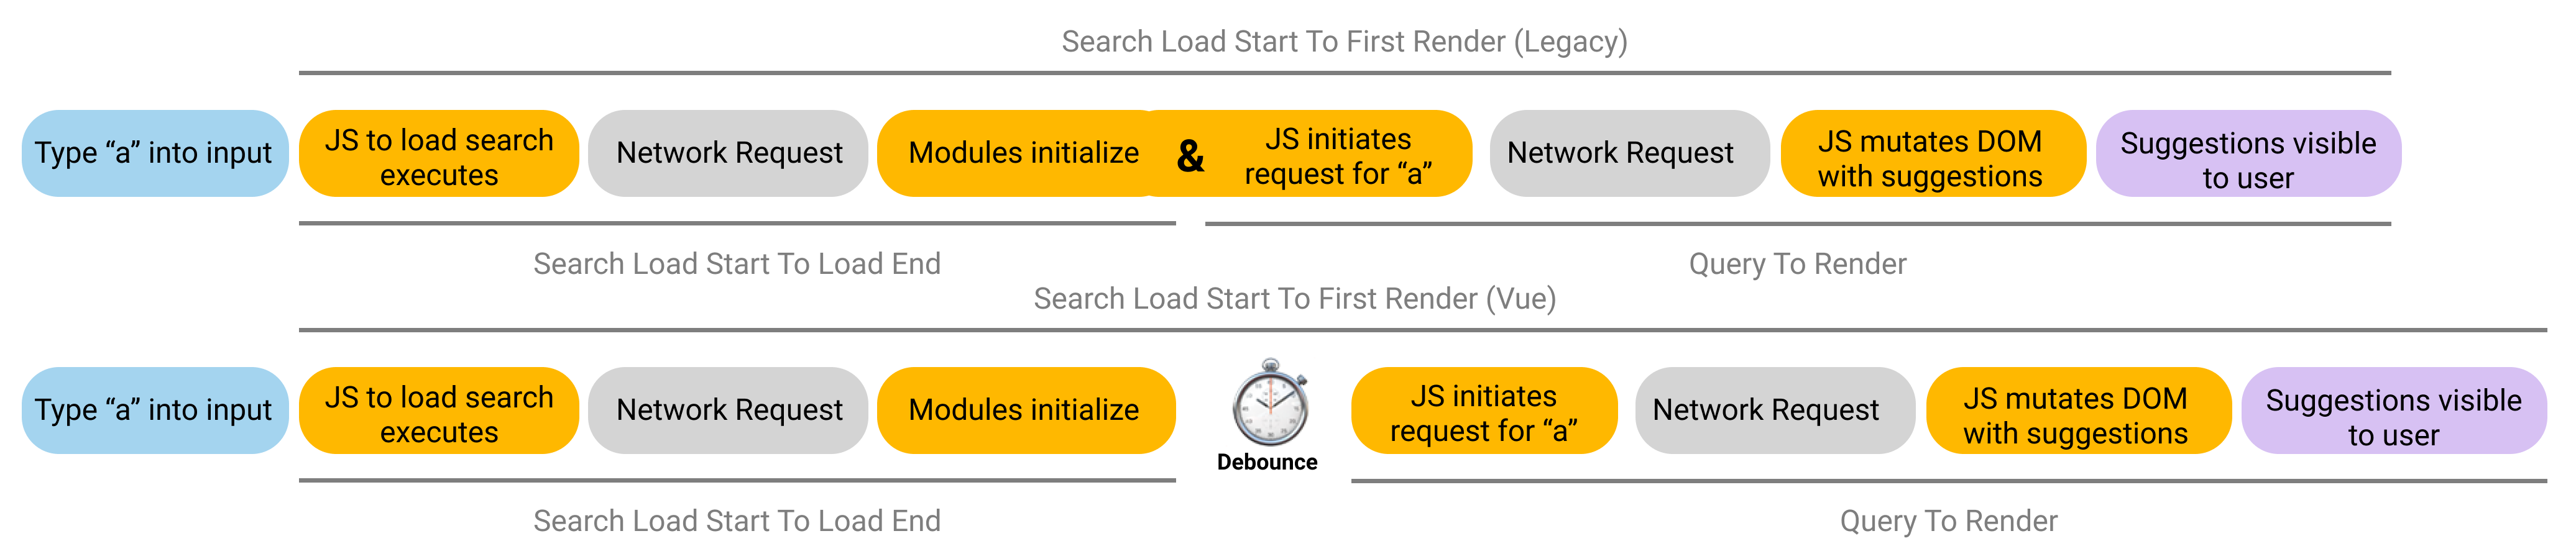
A single synthetic test collects one "Search Load Start To Load End" metric, one "Search Load Start To First Render" metric, and three "Search Query To Render" metrics as depicted below.

Disclaimer: In practice, the synthetic tests were a little more complex than depicted above. After typing the character "a" in the input and waiting for the suggestions to appear, the test would type "bc", wait for the suggestions, and then backspace and wait for the suggestions to appear for the query "ab". However, the net effect was that the queries "a", "ab", "abc" were still tested and, for simplicity, that is what is depicted.
Synthetic Test Results
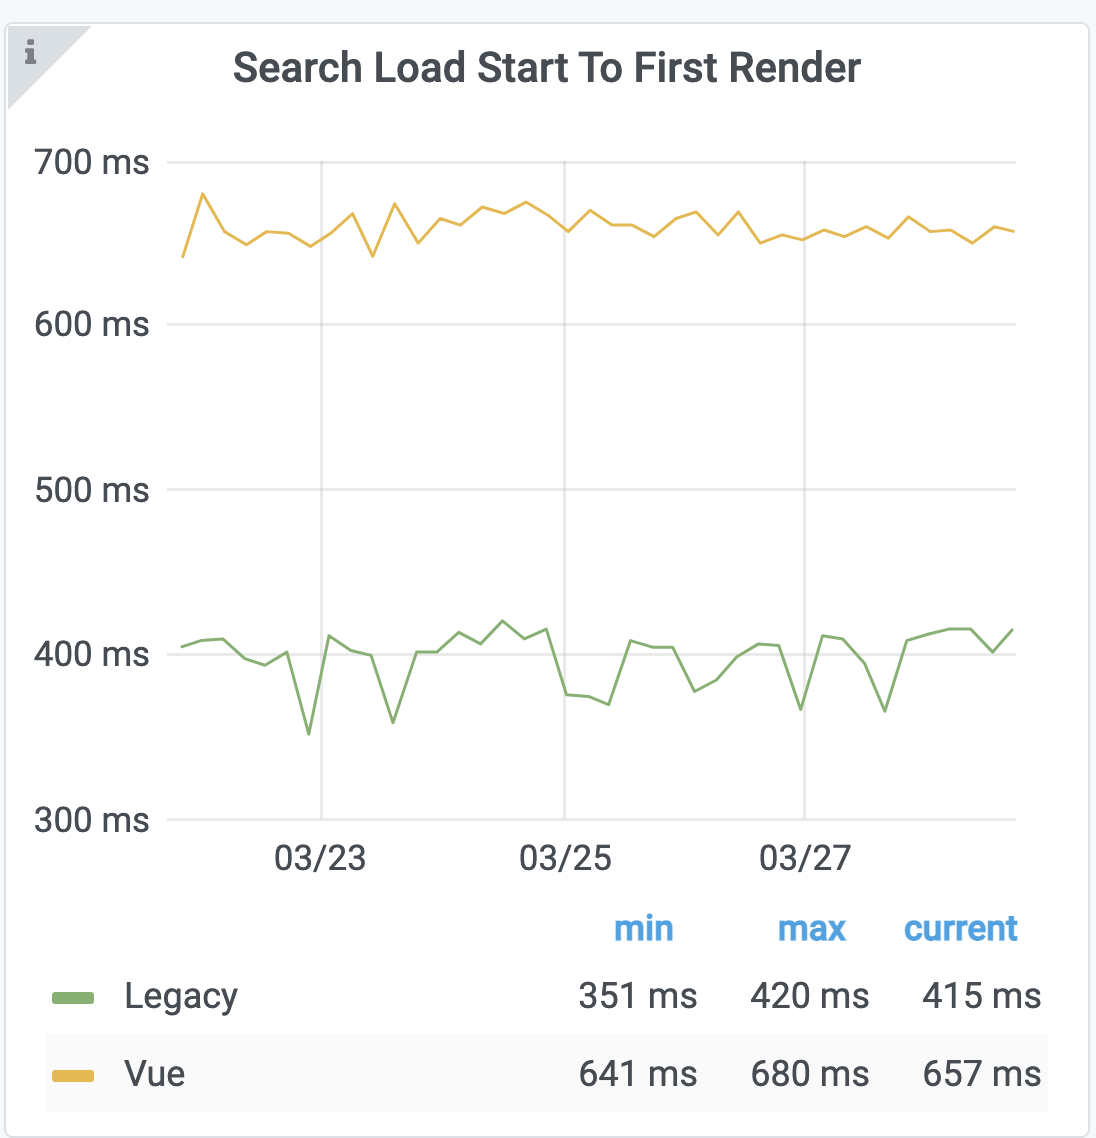
Towards the end of March 2021, I took a screenshot of the dashboard containing the synthetic test results that had been collected to that point. The results showed our Vue search implementation performing worse in each metric by a factor of ~1.7. 😱
Important factors to consider
Before getting too discouraged by these results, it's important to keep the following things in mind:
- Vue search and legacy search use different APIs (see "Query to Render" metric investigation for more on this). Additionally, the API that Vue search uses needs to fetch thumbnails and descriptions, while the legacy search API does not have this requirement.
- The synthetic tests are scripts and therefore exhibit artificial behavior. They are not real users. Testing real users may yield different results.
- The tests run with an empty browser cache. Of course, most users will have cache enabled so the differences represented in these results represent the worst-case scenario.
- The biggest differences we see in the results are several hundred milliseconds.
- The tests run from AWS instances from North Virginia and they tested French Wikipedia using the Barack Obama page.
- The internet connection speed is intentionally throttled to simulate poor internet connections.
- Each synthetic test performs 5 runs every ~4 hours and the median for each metric is used.
- Only three queries are tested (“a”, “ab”, “abc”). Other queries in the wild may deviate from these results.
At the surface, these results are disappointing but perhaps not surprising given the points above. However, I was unsatisfied with their ambiguity. While these graphs show Vue search performing worse in each metric, they don't convey which steps are worse in each metric. I wanted to know more. Therefore, I investigated deeper to find out where this time was spent.
Let's look at the timelines
Fortunately, our dashboard allows one to download and view the actual performance timelines that were recorded during each test. Given this ability, I imported each timeline into my Chrome browser and investigated the last 7 days of performance timelines that the synthetic tests had collected.
Search Load Start To Load End Investigation
Search Load Start To Load End: Network Request
As part of this metric, three steps could potentially be slow. Given that the "JS to load search executes" is relatively fast, let's first focus on the "Network Request" step.

| Test | Search Load Start To Load End | Network Request |
|---|---|---|
| legacy-2021-03-27 9:40:00 | 274.04 ms | 112.89 ms |
| vue-2021-03-27 10:10:00 | 565.24 ms | 217.86 ms |
| legacy-2021-03-26 00:10:00 | 283.21 ms | 113.53 ms |
| vue-2021-03-26 00:30:00 | 521.03 ms | 218.06 ms |
| legacy-2021-03-24 22:50:00 | 285.71 ms | 113.76 ms |
| vue-2021-03-24 23:10:00 | 526.49 ms | 217.87 ms |
| legacy-2021-03-24 01:30:00 | 306.10 ms | 113.10 ms |
| vue-2021-03-24 01:50:00 | 564.24 ms | 217.99 ms |
| legacy-2021-03-22 23:50:00 | 294.11 ms | 113.25 ms |
| vue-2021-03-23 00:10:00 | 535.96 ms | 217.67 ms |
| legacy-2021-03-21 22:30:00 | 287.76 ms | 112.85 ms |
| vue-2021-03-21 23:00:00 | 515.66 ms | 217.73 ms |
| legacy-2021-03-21 01:30:00 | 273.39 ms | 112.92 ms |
| vue-2021-03-21 01:50:00 | 500.94 ms | 217.92 ms |
As can be seen from the table above, the network request to load Vue search modules is taking ~1.9x as long to complete. When I examined legacy and Vue's respective network requests, I found significant differences in the payload size of the response containing their relevant modules. The 69.6 kB payload size to lazy load Vue search dwarfs the 6.9 kB payload size to load legacy search. Legacy search depends on jQuery but since that library is loaded when the page loads on Wikipedia, it does not influence this step. However, the Vue.js library is loaded during the lazy load of Vue search. This helps explain the performance differences observed in the table.

Search Load Start To Load End: Modules initialize
Next, we'll look at the "Modules initialize" step where the JS that was downloaded as part of the "Network Request" step gets executed.

| Test | Search Load Start To Load End | Modules Initialize |
|---|---|---|
| legacy-2021-03-27 9:40:00 | 274.04 ms | 7.48 ms |
| vue-2021-03-27 10:10:00 | 565.24 ms | 209.61 ms |
| legacy-2021-03-26 00:10:00 | 283.21 ms | 7.48 ms |
| vue-2021-03-26 00:30:00 | 521.03 ms | 204.38 ms |
| legacy-2021-03-24 22:50:00 | 285.71 ms | 7.29 ms |
| vue-2021-03-24 23:10:00 | 526.49 ms | 207.45 ms |
| legacy-2021-03-24 01:30:00 | 306.10 ms | 10.95 ms |
| vue-2021-03-24 01:50:00 | 564.24 ms | 187.19 ms |
| legacy-2021-03-22 23:50:00 | 294.11 ms | 10.62 ms |
| vue-2021-03-23 00:10:00 | 535.96 ms | 211.23 ms |
| legacy-2021-03-21 22:30:00 | 287.76 ms | 13.19 ms |
| vue-2021-03-21 23:00:00 | 515.66 ms | 211.72 ms |
| legacy-2021-03-21 01:30:00 | 273.39 ms | 9.04 ms |
| vue-2021-03-21 01:50:00 | 500.94 ms | 191.82 ms |
Notice from the table above that the time it takes to initialize Vue search modules takes roughly ~20x as long. The relatively large execution time for Vue search is somewhat intuitive given that it uses a reactive framework with a larger footprint than legacy search.
Disclaimer: The timeline bars I observed for this data were fairly ambiguous for Vue search. The data above reflects my best guess as to what was happening, but there is a possibility that it is not accurate.
Search Query To Render Investigation
Search Query To Render: Network Request

Since there are three "Search Query To Render" metrics collected during a test (for the queries "a", "ab", "abc"), let's looks at the time it took for each network request.
| Test | Network Request #1 | Network Request #2 | Network Request #3 |
|---|---|---|---|
| legacy-2021-03-27 9:40:00 | 34.78 ms | 33.53 ms | 33.67 ms |
| vue-2021-03-27 10:10:00 | 34.74 ms | 37.97 ms | 105.01 ms |
| legacy-2021-03-26 00:10:00 | 34.68 ms | 33.70 ms | 33.55 ms |
| vue-2021-03-26 00:30:00 | 34.77 ms | 104.25 ms | 108.77 ms |
| legacy-2021-03-24 22:50:00 | 34.82 ms | 33.59 ms | 33.59 ms |
| vue-2021-03-24 23:10:00 | 34.99 ms | 93.08 ms | 114.89 ms |
| legacy-2021-03-24 01:30:00 | 35.31 ms | 33.61 ms | 33.48 ms |
| vue-2021-03-24 01:50:00 | 34.46 ms | 100.22 ms | 72.55 ms |
| legacy-2021-03-22 23:50:00 | 34.40 ms | 33.51 ms | 33.57 ms |
| vue-2021-03-23 00:10:00 | 34.58 ms | 110.39 ms | 138.15 ms |
| legacy-2021-03-21 22:30:00 | 34.90 ms | 34.05 ms | 33.46 ms |
| vue-2021-03-21 23:00:00 | 34.83 ms | 105.89 ms | 91.70 ms |
| legacy-2021-03-21 01:30:00 | 34.98 ms | 33.92 ms | 33.47 ms |
| vue-2021-03-21 01:50:00 | 34.49 ms | 34.28 ms | 109.56 ms |
The table shows that the time it takes the legacy search ajax request to complete is more consistent than Vue search. The Vue search network request is more variable and sometimes 3x-4x slower than legacy search.
These results were a little peculiar to me. Vue search uses a different API/endpoint (our REST API) than legacy search (which uses our Action API), and Vue search was the default search experience for anonymous users (the majority of Wikipedia's userbase) on French Wikipedia. Since the respective API for legacy search and Vue search takes advantage of our edge front-end caching infrastructure, I'd think our caching infrastructure for Vue search would have been more primed than legacy search and would have shown more consistency. Unfortunately, determining whether the response came from the edge or not was not available info in the timelines I downloaded. I hypothesize that the < 50 ms requests in this table are coming from the edge cache, but oddly enough there is a higher percentage of legacy requests in this category.
Another factor that might be playing a role here is that the Vue search API has to fetch more data than legacy search. The Vue search needs that that includes article titles, thumbnails, and descriptions whereas legacy search only needs to fetch article titles. The extra work that the Vue search API must do to produce a response might help explain why the Vue search request can sometimes take longer than the legacy search request. The instances where the request time is the same might be explained by the response coming from the edge cache.
Search Query To Render: JS mutates DOM with suggestions

| Test | JS Execution #1 | JS Execution #2 | JS Execution #3 |
|---|---|---|---|
| legacy-2021-03-27 9:40:00 | 47.74 ms | 38.05 ms | 37.92 ms |
| vue-2021-03-27 10:10:00 | 15.51 ms | 19.12 ms | 12.99 ms |
| legacy-2021-03-26 00:10:00 | 46.19 ms | 36.29 ms | 37.38 ms |
| vue-2021-03-26 00:30:00 | 19.79 ms | 14.03 ms | 13.80 ms |
| legacy-2021-03-24 22:50:00 | 49.19 ms | 38.37 ms | 40.14 ms |
| vue-2021-03-24 23:10:00 | 17.08 ms | 12.89 ms | 12.86 ms |
| legacy-2021-03-24 01:30:00 | 49.17 ms | 37.93 ms | 36.21 ms |
| vue-2021-03-24 01:50:00 | 15.87 ms | 14.29 ms | 14.30 ms |
| legacy-2021-03-22 23:50:00 | 52.74 ms | 37.04 ms | 36.18 ms |
| vue-2021-03-23 00:10:00 | 16.32 ms | 15.53 ms | 17.00 ms |
| legacy-2021-03-21 22:30:00 | 43.56 ms | 36.89 ms | 34.47 ms |
| vue-2021-03-21 23:00:00 | 19.49 ms | 13.16 ms | 16.15 ms |
| legacy-2021-03-21 01:30:00 | 52.11 ms | 38.61 ms | 36.62 ms |
| vue-2021-03-21 01:50:00 | 17.76 ms | 13.95 ms | 13.41 ms |
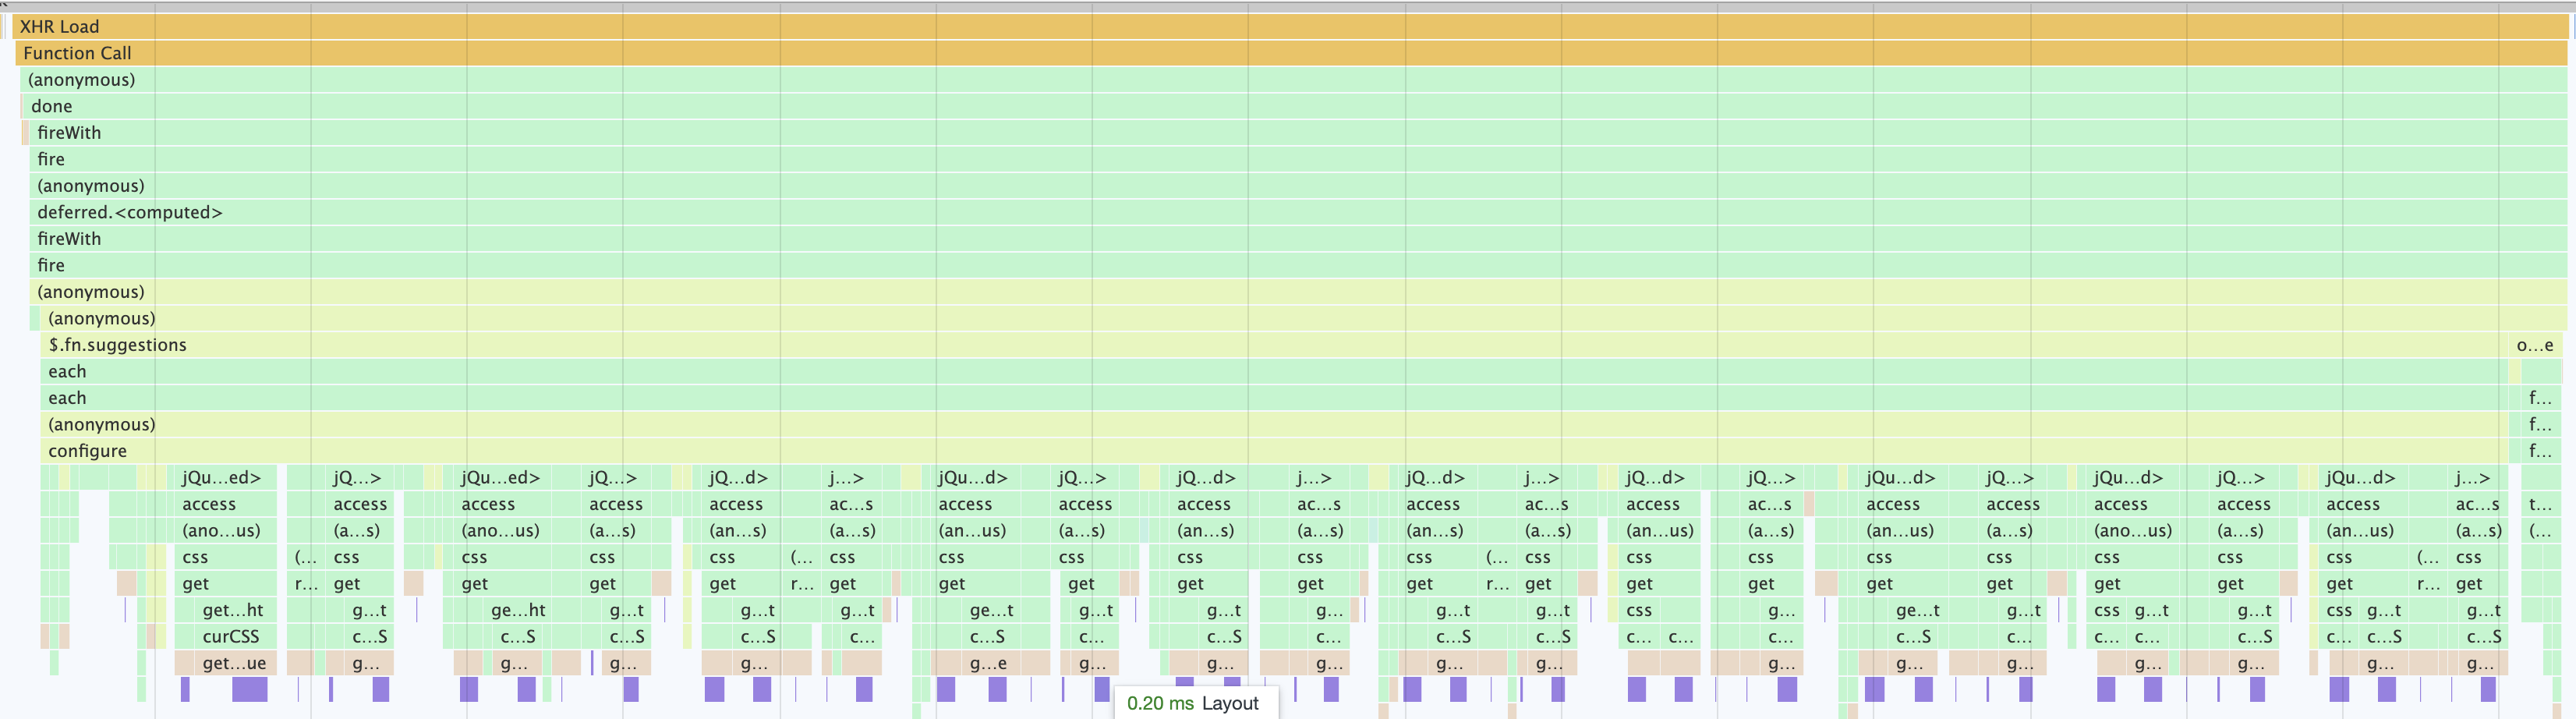
The tables show legacy search JS execution time (after the network request) is often 2x-4x that of Vue search. Out of all the steps I analyzed, this was one of the most interesting to me. Why would Vue search which uses Vue.js and has the overhead of a virtual DOM be faster than legacy search which has no such overhead and uses imperative jQuery DOM manipulations?
To answer this question, I investigated a performance timeline from legacy search and found that legacy search had a series of purple "recalc style" and "layout" bars. One pair of these bars is referred to as a forced synchronous layout and can be a potential source of inefficiency. However, when those bars repeat in succession like depicted below, it is commonly referred to as "layout thrashing" and is an even bigger bottleneck. Taking this into account, it became much easier to see why Vue search made up some ground and performed better than legacy search for this step.
Search Load Start To First Render Investigation
Search Load Start To First Render: Is there more?

Since the "Search load start to first render" metric is a superset of the "search load start to load end" metric and the first "search query to render" metric, we'd expect that all the factors that led to Vue performing worse in the previous metrics would play a role in this metric. This is true, but it turns out that there is an additional factor to consider between the "modules initialize" step and the "JS initiates request for 'a'" step.
While both search implementations use a debouncer to prevent excessive network requests when the user rapidly types (or holds down a key), the legacy search implementation fires a network request during the module initialization step if it detects characters in the input while the Vue search implementation debounces/delays the request when this same scenario is recognized. While this should be easily correctable, it certainly plays a role in this metric as Vue search was using a 200ms debounce time when these results were recorded.
Conclusion
From my analysis, I believe the following to be true at the time of this writing:
- Vue search’s JS modules are slower to load than legacy search’s modules. This is likely because of a 10x increase (6.9 kB vs 69 kB) in payload size.
- Vue search’s JS modules are slower to initialize than legacy search’s modules.
- Vue search's JS handling of each ajax response is faster than legacy search. This is likely due to legacy search’s inefficient layout thrashing.
- All of the metrics collected are influenced by network requests including whether they have been cached by the edge (e.g. Varnish).
- The legacy search API usually has a faster network response for the queries “ab” and “abc”, but both have similar speeds for the query “a”. This might be related to the fact that the Vue search API must do more work than legacy search API to produce a response by needing to include thumbnails and descriptions.
- Vue search is influenced by debounce time during the "Search Load Start To First Render" metric. Legacy search fires the request immediately if the input while the search modules are loading. We should be able to easily improve Vue search in this regard.
During this analysis, I looked at many performance timelines and data. You can take a closer look at the same data I observed by importing the timelines I saved in a repo. Let me know if you find anything interesting!